3 Genome wide association analysis
3.1 How do we conduct GWAS analysis?
Association analysis was conducted with the mixed model implemented in the EMMAX software package (version emmax-beta-07Mar2010). The high-quality SNP data obtained from VariantFiltration function in GATK were further filtered by software PLINK (v.1.90b6.12 64-bit) to keep variants with a missing rate ≤10% and minor allele frequency ≥5%. Principal component analysis was performed using the high-quality SNP set by the software GCTA, and the first two principal components were incorporated as the covariates to effectively account for population structure.
Permutation analysis was performed to help define the genome-wide significance threshold. We randomly picked ten traits (comprising heading date, tiller angle, leaf width, plant height, full grain number per panicle, kilo-grain weight, amylose content, gel consistency, grain translucency and grain shape), reshuffled the original phenotypic observations, and then performed association analysis as description above. A total of 100 permutation tests was performed and four association signals passing through the significant threshold 10^-6 were detected. This suggested a feasible FDR (false discovery rate) level of <0.05 when the whole-genome significant cutoff was set as 10^-6.
3.2 How to search for GWAS results of desired trait?
Users can get access to GWAS results by clicking the “Phenotype & GWAS” or “Phenotype” button on the home page (Figure3.1)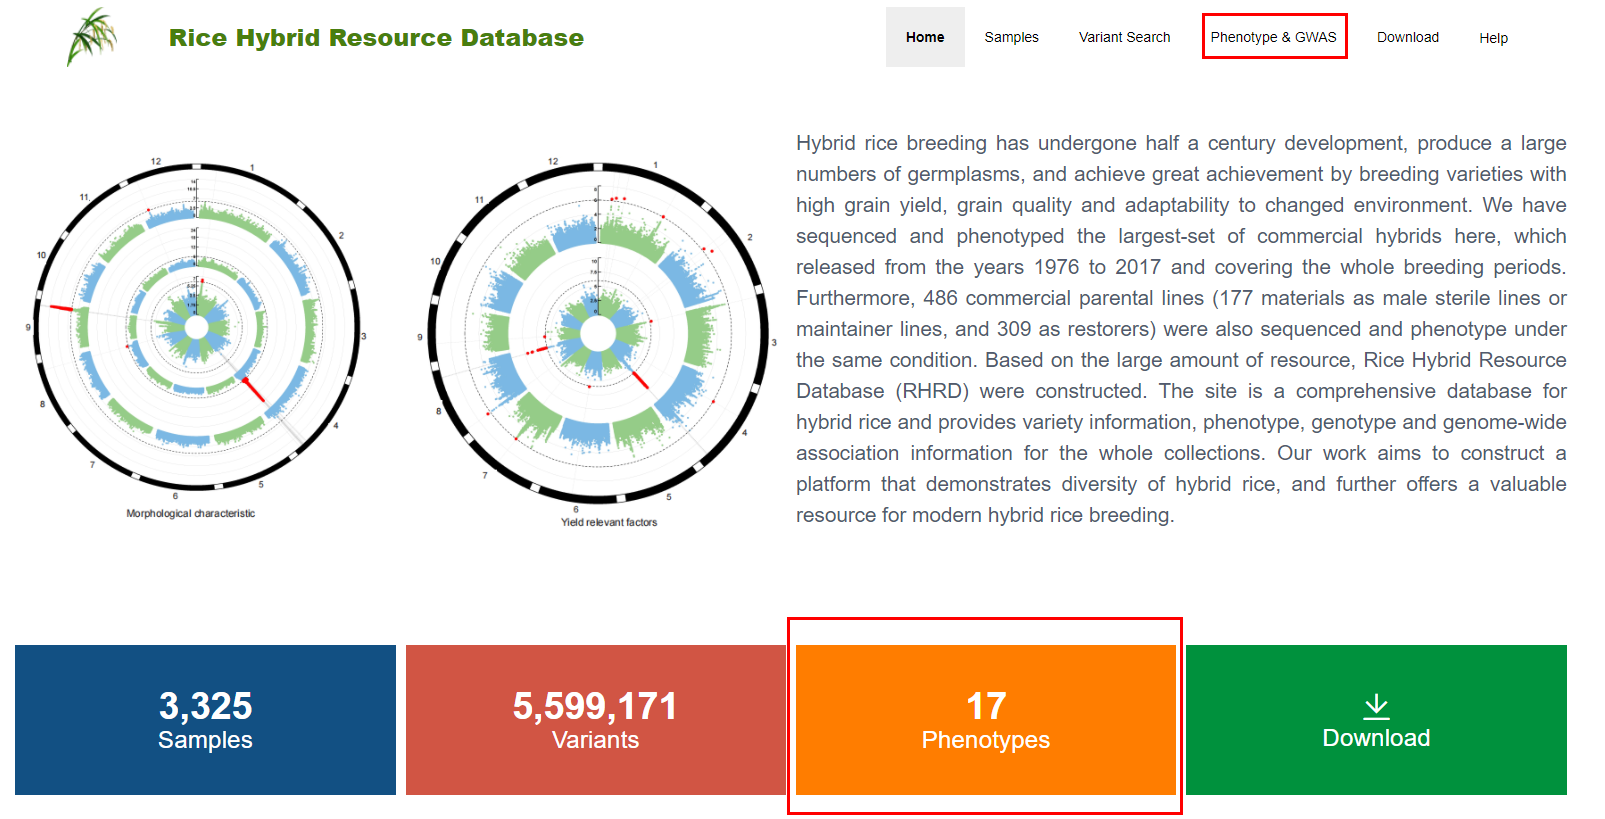
Figure 3.1: The navigation bar on the home page
After entering the “phenotypic & GWAS” page, users should first specify the desired phenotype at the search box (Figure3.2) and then submit. The GWAS results are displayed on the bottom of the page (Figure3.3).
Note
Only the significant signals with -log10(p-value) larger than 10^6 are shown in the figure.
Significant signals on adjacent chromosomes are colored in different colors.
Users can place cursor to show details for any significant signal in the figure.
Users can edit and download the figure by the taskbar above the figure, and download the raw data of GWAS results by the “Data download” button.
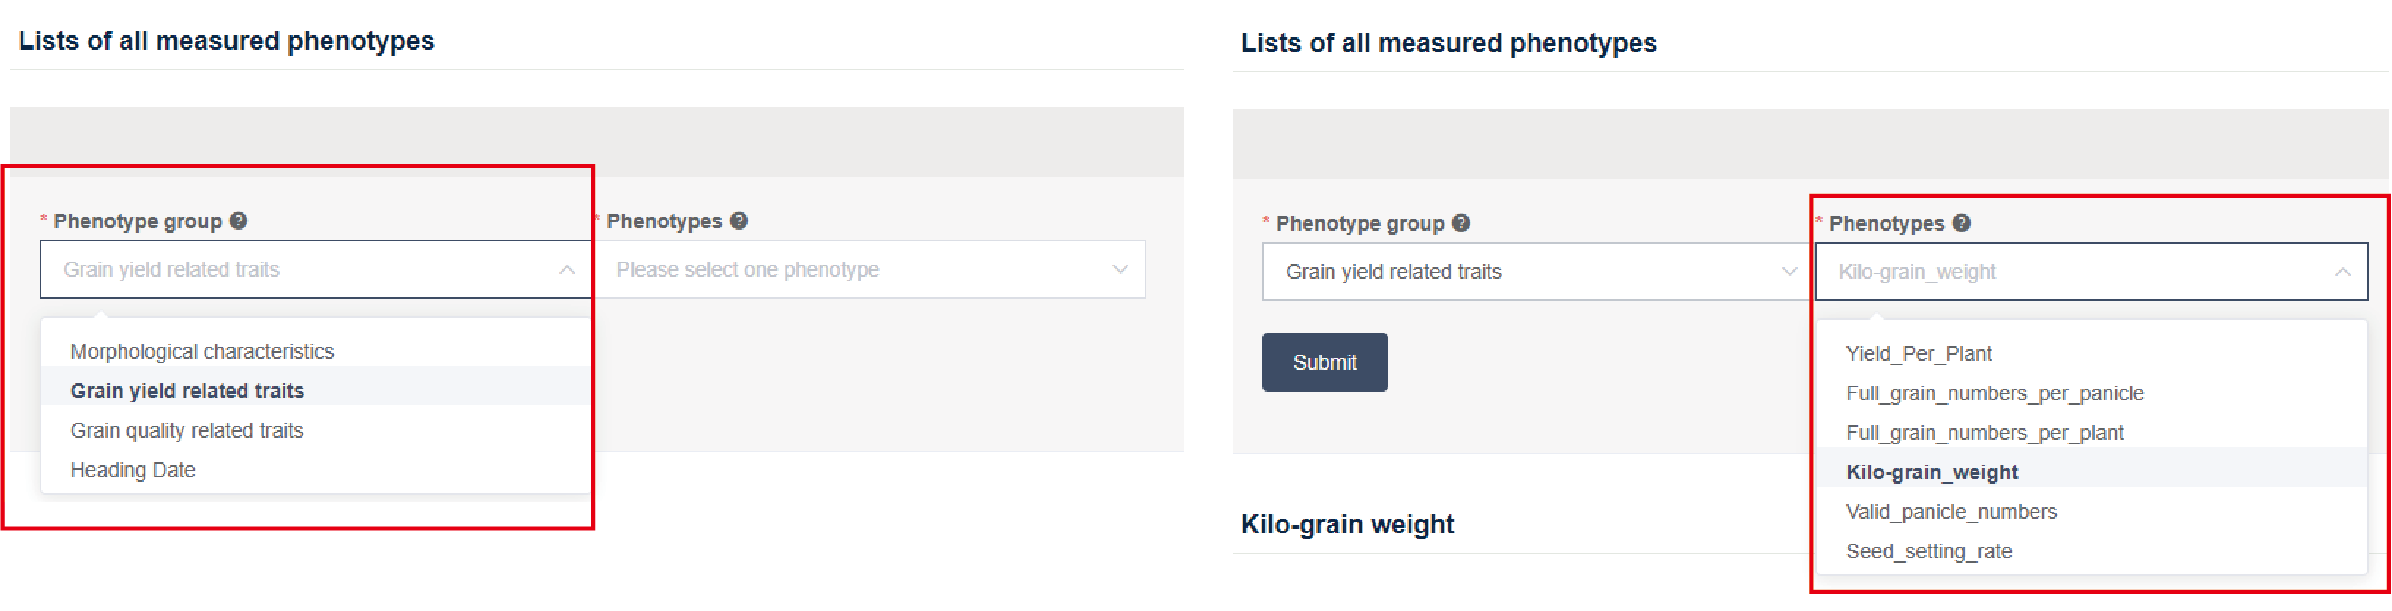
Figure 3.2: Searching for GWAS results
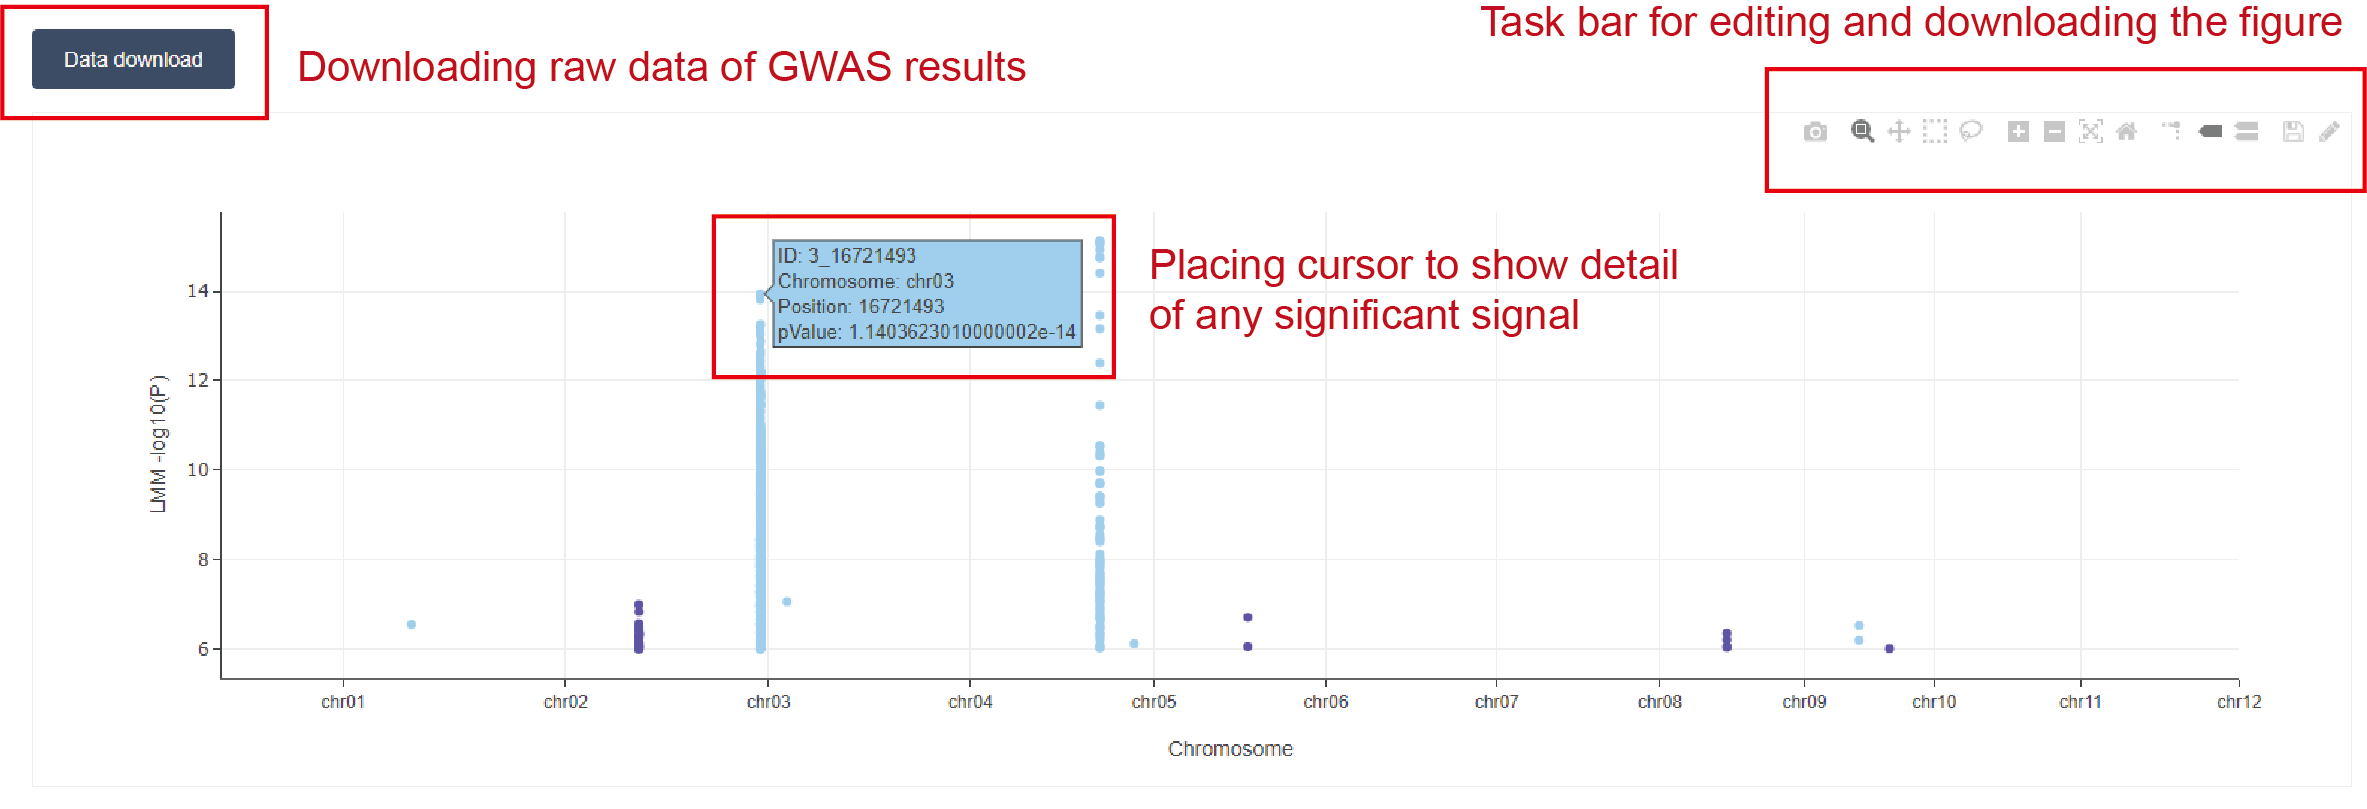
Figure 3.3: GWAS results
3.3 Reference
Kang, H.M. et al. Variance component model to account for sample structure in genome-wide association studies. Nat Genet 42, 348-354 (2010).
Purcell, S. et al. PLINK: a tool set for whole-genome association and population-based linkage analyses. Am J Hum Genet 81, 559-575 (2007).
Yang, J., Lee, S.H., Goddard, M.E. & Visscher, P.M. GCTA: a tool for genome-wide complex trait analysis. Am J Hum Genet 88, 76-82 (2011).