1 Samples and phenotypes
1.1 The composition of our collections
Our collections are composed by commercially cultivated hybrid ecotypes, and parental lines of commercial hybrid rice.
| Ecotype | Count |
|---|---|
| indica-indica hybrid rice | 2724 |
| indica-japonica hybrid rice | 68 |
| japonica-japonica hybrid rice | 47 |
| male sterile line for three-line system | 76 |
| maintainer line for three-line system | 60 |
| male sterile line for two-line system | 41 |
| restorer line | 309 |
1.2 Which phenotypic observations are included in the datasets? And how we conducted phenotypic investigation?
Hybrid rice and parental lines are planted and comprehensively phenotyped for 17 key agronomical traits, comprising one physiological trait, four morphological characteristics, six grain yield related traits and six grain quality related traits.
| Type | Trait |
|---|---|
| physiological trait | heading date |
| morphological characteristic | plant height |
| morphological characteristic | leaf length |
| morphological characteristic | leaf width |
| morphological characteristic | tiller angle |
| yield-related trait | yield per plant |
| yield-related trait | full grain numbers per plant |
| yield-related trait | valid panicle numbers |
| yield-related trait | full grain numbers per panicle |
| yield-related trait | seed setting rate |
| yield-related trait | kilo-grain weight |
| grain quality related trait | amylose content |
| grain quality related trait | gel consistency |
| grain quality related trait | chalkiness |
| grain quality related trait | chalky rice percentage |
| grain quality related trait | grain translucency level |
| grain quality related trait | grain shape(length to width ratio of polished rice) |
All samples were planted in an experimental field in Hangzhou in China in summer of 2020. For each accession, fifteen samples were germinated and planted in three rows with row and column spacing setting to 20 and 26.7 cm, respectively. Plants in the middle of the plot were selected to conduct phenotyping. Seventeen traits were measured in this work, including four morphological characteristics (leaf length, leaf width, plant height and tiller angle), six yield components and relevant factors (full grain number per plant, valid panicle number, full grain number per panicle, kilo-grain weight, seed setting rate and yield per plant), six grain-quality-related traits (amylose content, gel consistency, chalkiness, chalky grain percentage, grain translucency, grain shape) and one physiological feature (heading date). Among them, heading date, leaf length, leaf width, plant height and tiller angle were measured in the field. The heading date was recorded as the duration in days from the date of sowing to the emergence of first inflorescences above flag leaf sheath of five plants for each accession. The other four field traits were investigated after heading and three individuals were selected for phenotyping: plant height, flag leaf length and width of the tallest panicle were measured; tiller angle was measured between tiller and the ground level. The collection of observations for grain-related traits was carried out in the laboratory after harvest. Full grain number per plant, valid panicle number, full grain number per panicle, seed setting rate, kilo-grain weight and yield per plant were investigated with three biological replicates for each sample. Full grain number per plant was counted manually; valid panicle number was directly counted after removing ineffective panicles; full grain number per panicle was estimated by dividing the full grain number per plant by the valid panicle number; seed setting rate was estimated by calculating the ratio of full grain number to total grain number per plant; kilo-grain weight was obtained by weighing 400 fully filled grains and then converting the value to 1000-grain weight; yield per plant was recorded as the weight of all full grains per plant. Grain quality traits were investigated according to the Chinese national standard (NY/T 2334-2013 ‘Determination of head rice yield, grain shape, chalky grain percentage, chalkiness degree and translucency – An image analysis method’). Grain shape was measured as length to width ratio of polished grain, which was the grain having its husk and outer brown layers removed. Grains from mixed harvest were randomly selected to conduct phenotyping for grain quality-related traits, with two replicates prepared for each sample.
1.3 How to search sample information?
Users can get access to sample information by clicking the “Samples” button on the navigation bar (as shown in Figure1.1)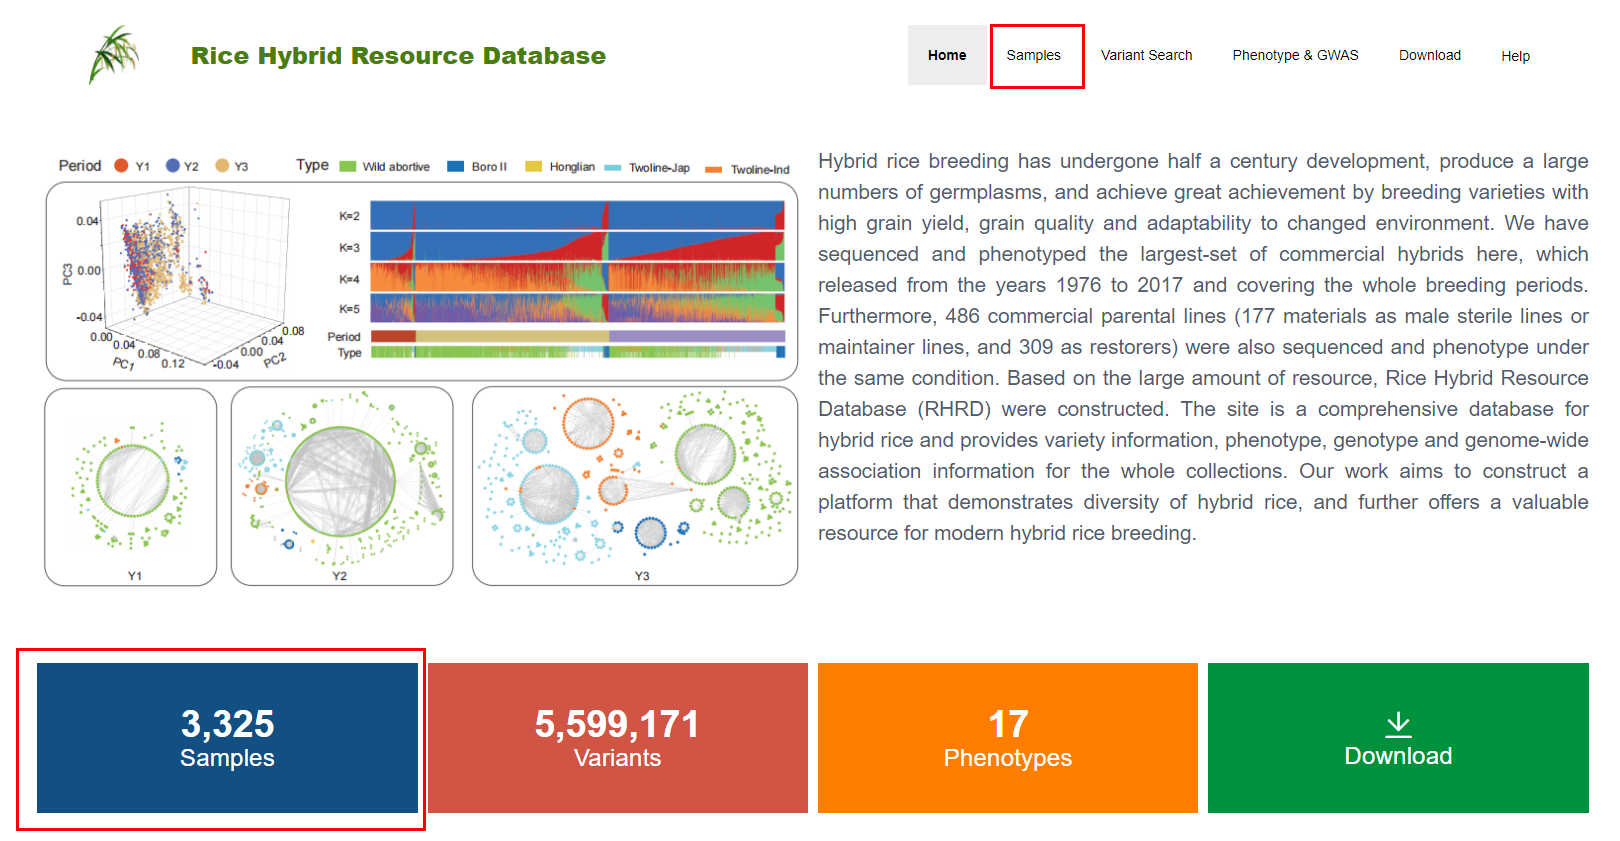
Figure 1.1: The navigation bar on the home page
1.4 Overview the composition of “Samples” page
1.4.1 Sample compositions
On the top of the “Sample” page, the pie charts depict the sample composition, the hybrid compositions of different ecotypes and the distribution of hybrids from different breeding periods (Figure1.2).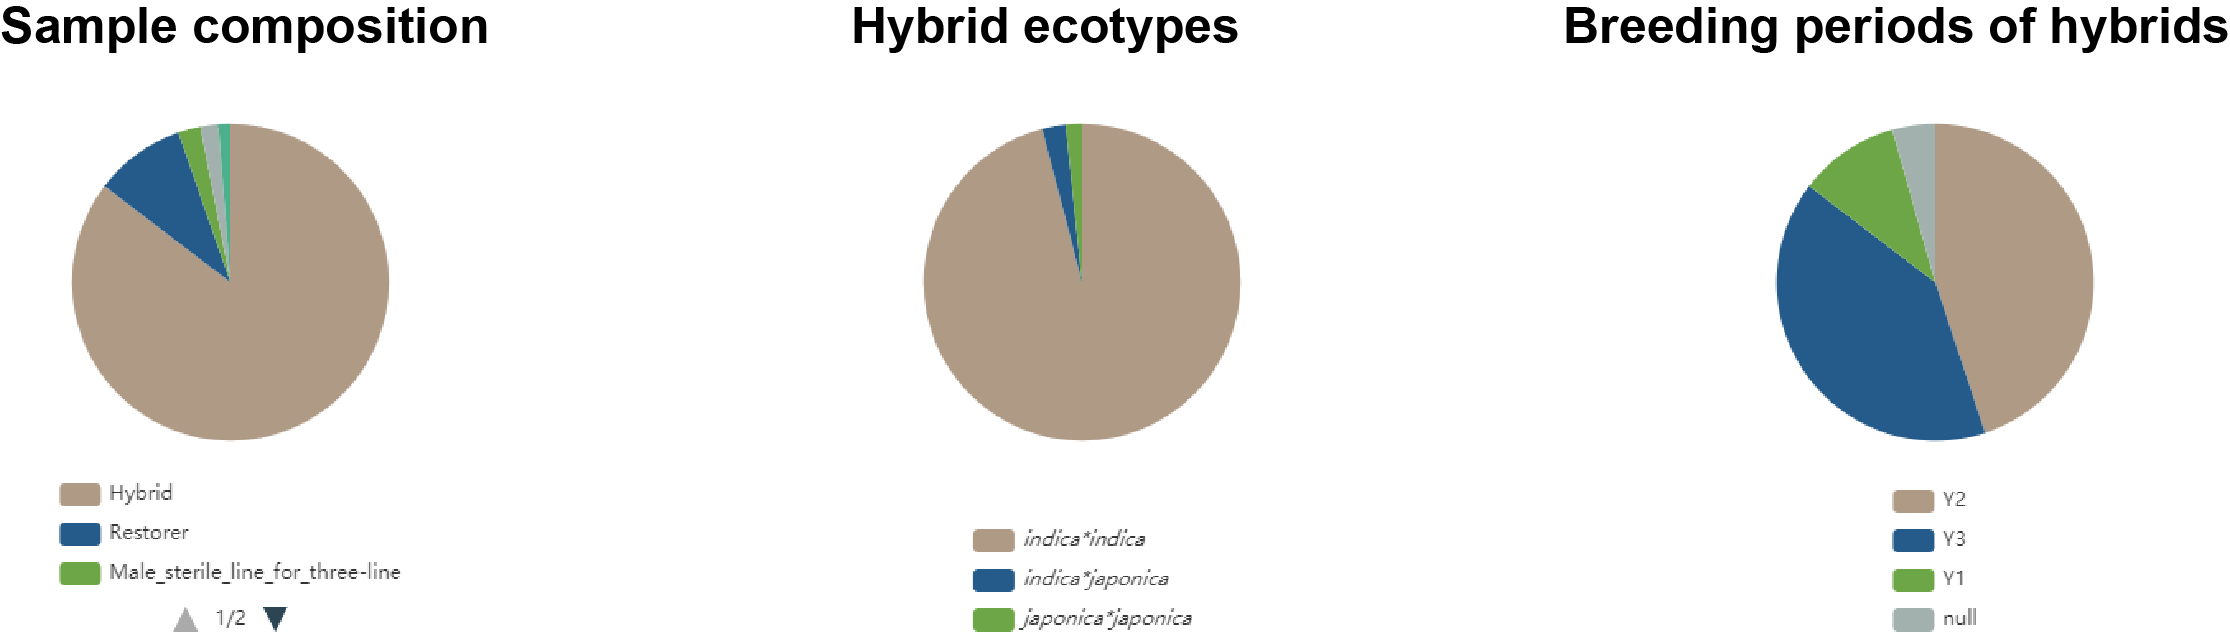
Figure 1.2: Sample compositions
1.4.2 Detail information of samples
The sample information are listed following the pie charts, comprising sample ID, sample name, sample type, ecotype (for hybrids), breeding year (for hybrids), breeding period (for hybrids), breeding system (for hybrid production) and subpopulation. Sample type include hybrid, restorer, male sterile line for three-line system, male sterile line for two-line system and maintainer line for three-line system. Ecotype (for hybrids) include indica*indica hybrid, indica*japonica hybrid and japonica*japonca hybrid. Breeding year of a hybrid is defined as the year occurring three years prior to the year that sample passed the variety approval. The timing of hybrid improvements can roughly be devided into three periods: breeding period of 1976-2000 (Y1), 2001-2010 (Y2), 2011-2020 (Y3). Breeding system for hybrid production include WA (wild abortive), BT (Boro II) and HL (Honglian) for three-line breeding system, and Twoline-Japonica and Twoline-Indica for two-line breeding system.
A global search function is provided for quickly accessing one or more samples (Figure1.3).Note
The Y1 to Y3 classification for hybrid collections based on:
I. Policy steering in late 1990s and 2000s. China Ministry of Agriculture established a national mega project entitled “Breeding and cultivation system of super rice in China” in 1996. The project encouraged combined use of heterosis and ideal plant type to increase yield, and they set standards for ideal plant type of super rice: erect panicle model, long erect leaves with delayed senescence model, early vigorous growth and heavy panicle model (Qian et al., 2020).
Boom of two-line hybrid in 2000s.
Progress of breeding technology. The finished quality sequence of rice genome was released in 2005 (International Rice Genome Sequencing, 2005). With the reference sequence available and development of high-throughput sequencing and genotyping, rice molecular biology and functional genomics made great progress, which further accelerated the rational design and molecular breeding of hybrid super rice by marker assisted selection and marker assisted gene pyramiding in the past decade (Qian et al., 2020; Zeng et al., 2017).
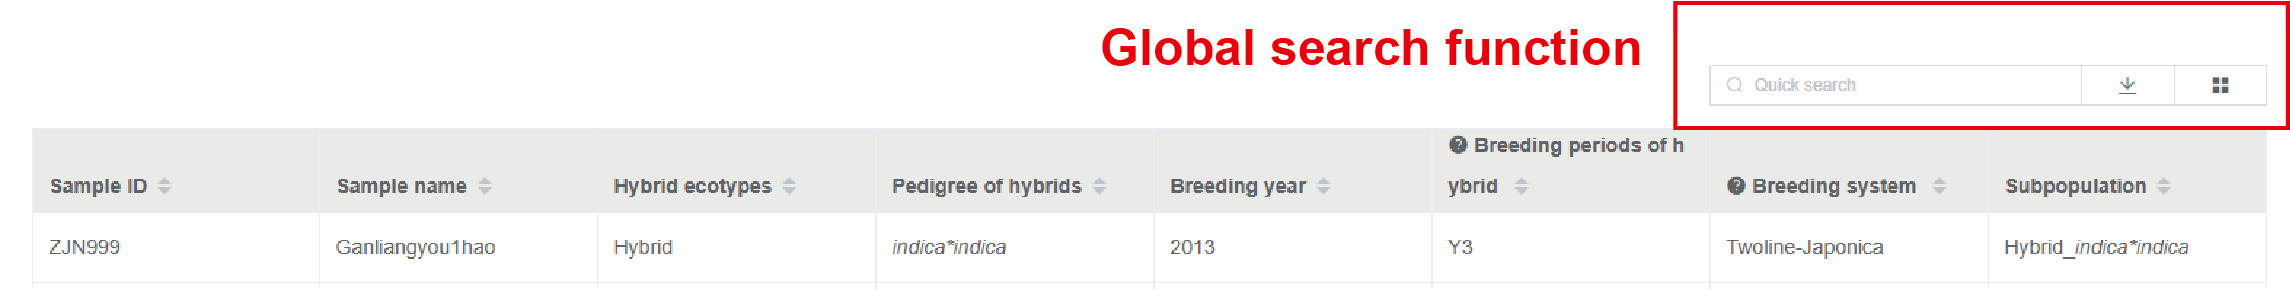
Figure 1.3: Global search for samples
1.4.3 Phenotypic distribution in subpopulations
On the bottom of the “Sample” page, boxplot demonstrates the phenotypic distribution of samples within subpopulation. And user can specify the desired phenotype at the search box as shown in Figure1.4.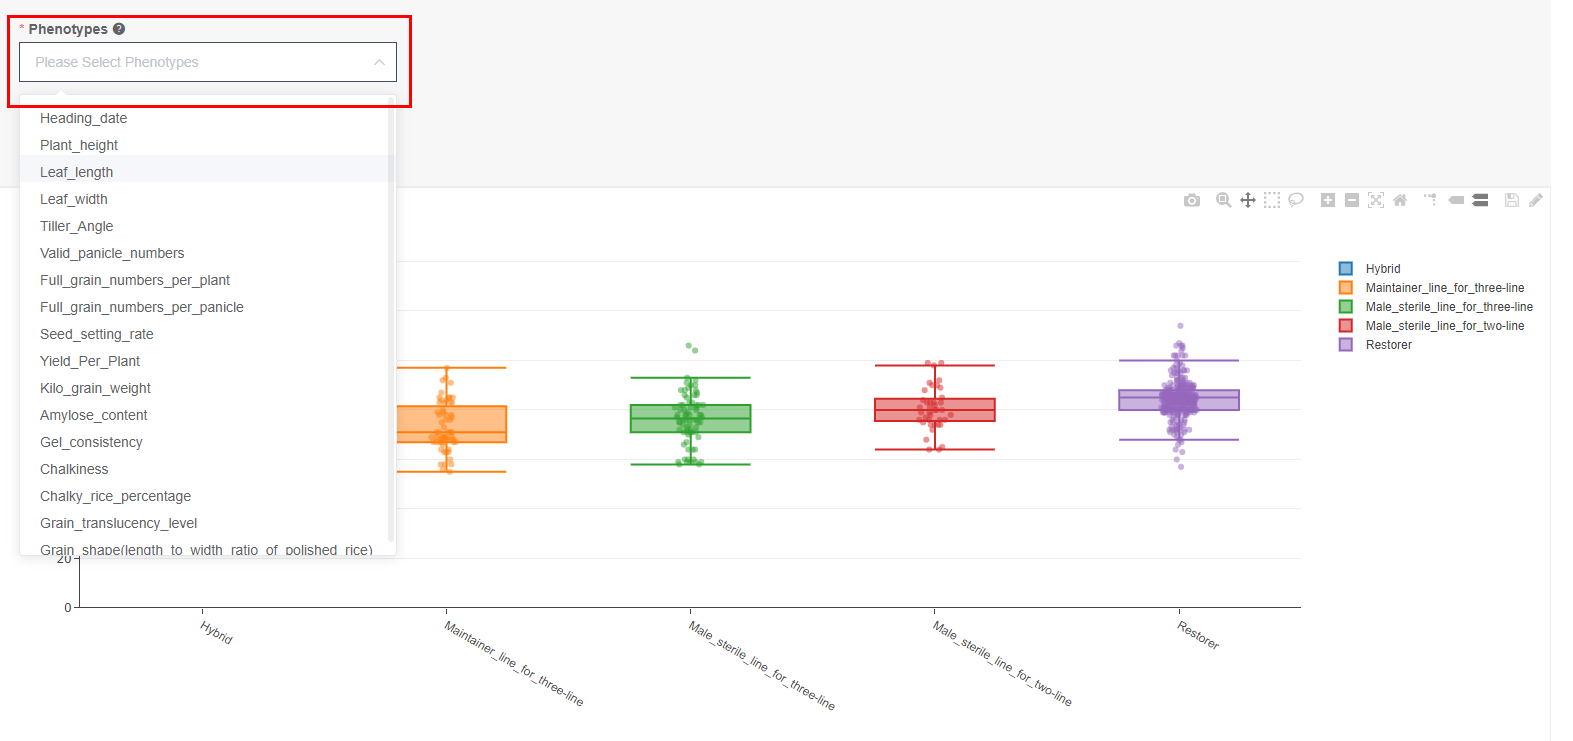
Figure 1.4: Selecting the desired phenotype
1.5 How to search phenotypic information?
For detail phenotypic information, users should click the “Phenotype & GWAS” or “Phenotypes” button on the navigation bar (as shown in Figure1.5).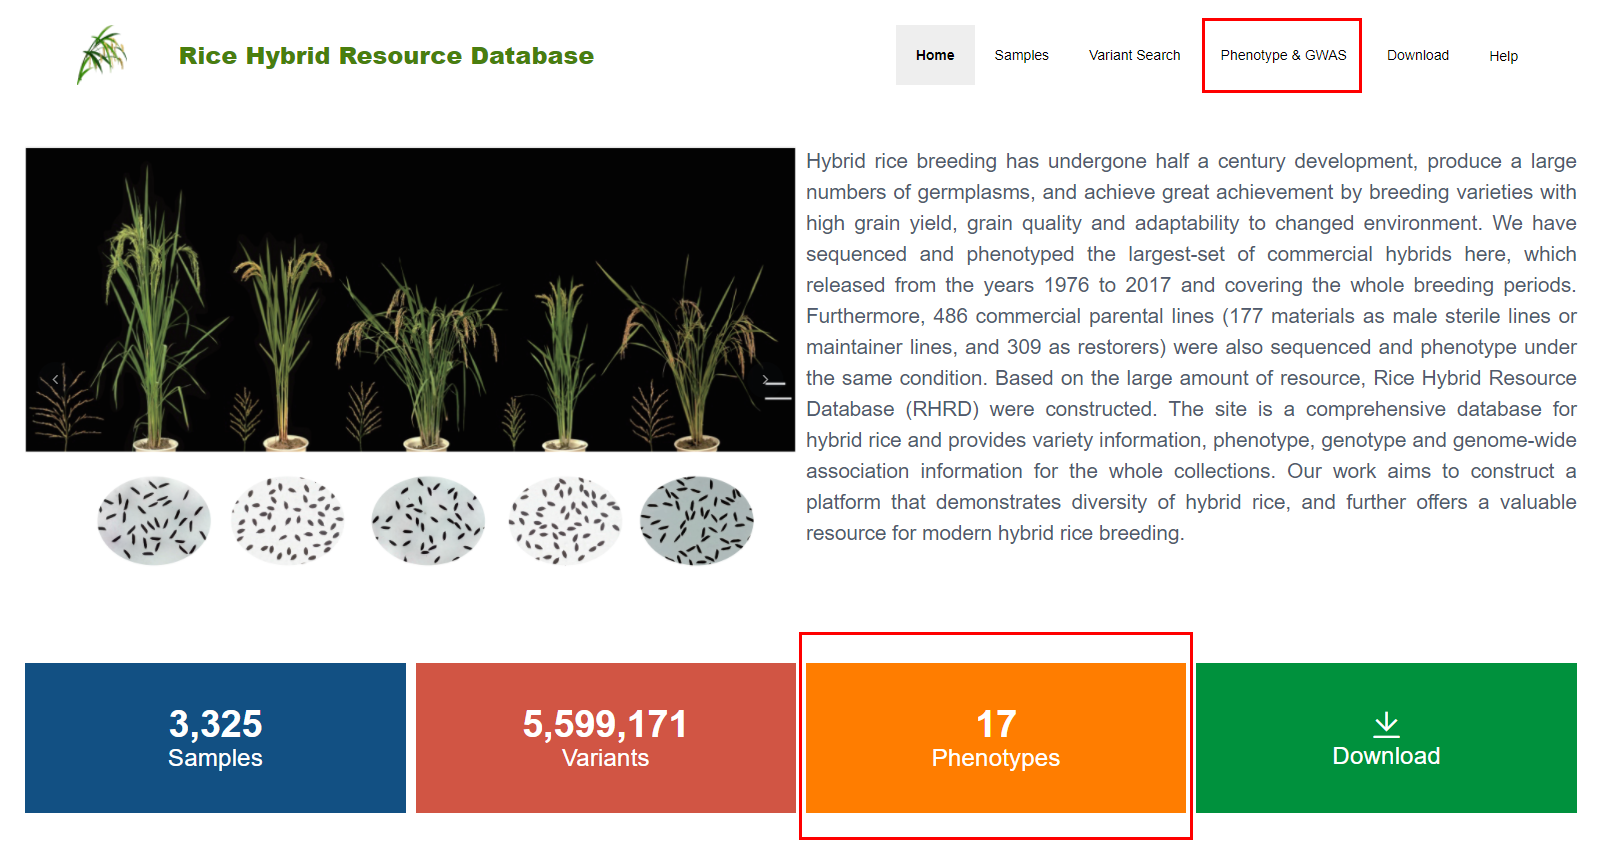
Figure 1.5: The navigation bar on the home page
Users can specify the desired phenotype at the search box, then the table below demonstrates the target phenotypic information for each accession. In addition, users can download the phenotypic data by pressing the “download” button (as shown in Figure1.6).
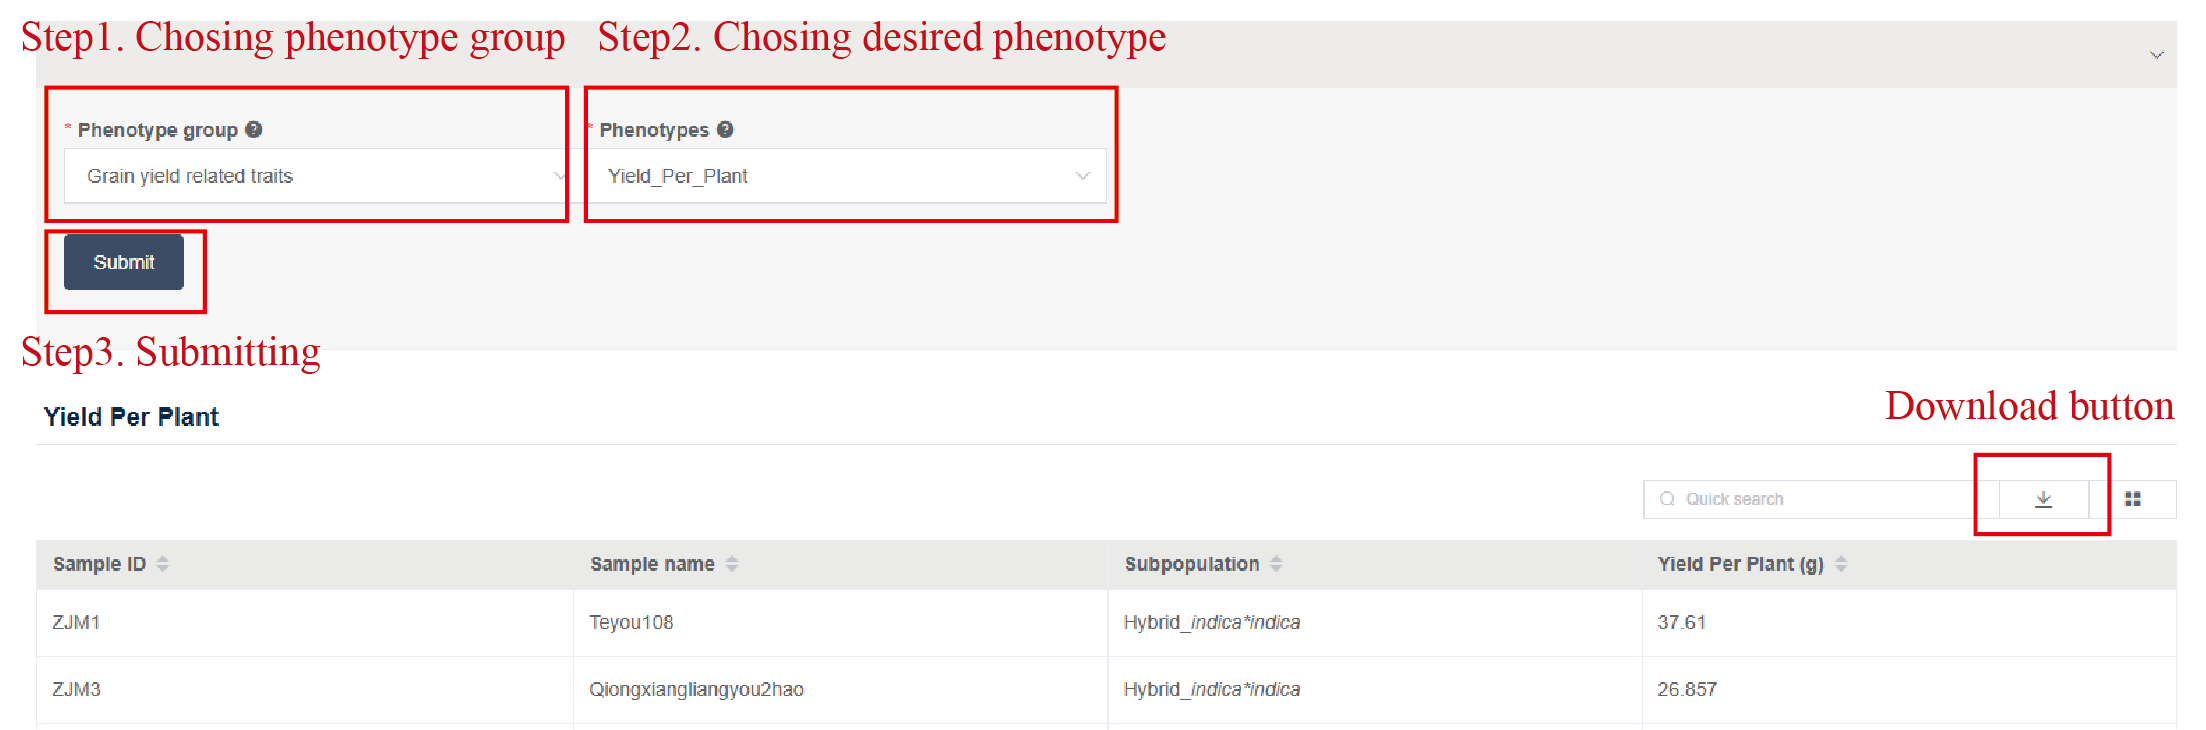
Figure 1.6: Selecting the desired phenotype and downloading the phenotypic data
1.6 Reference
Qian, Q., Guo, L., Smith, S.M. & Li, J. Breeding high-yield superior quality hybrid super rice by rational design. National Science Review 3, 283-294 (2016).
International Rice Genome Sequencing, P. The map-based sequence of the rice genome. Nature 436, 793-800 (2005).
Zeng, D. et al. Rational design of high-yield and superior-quality rice. Nat Plants 3, 17031 (2017).