8 GO/KEGG enrichment analysis
Performing functional enrichment analysis for given gene sets using the hypergeometric test.
8.1 Principles of over-representation enrichment analysis
- Let’s assume there are total
mgenes with Gene ontology annotation inAndrographis paniculataand there arengenes in pathwayA. - We have got a gene set
Gwithkgenes. Among them,lgenes are located in pathwayA. - Question: Would genes in gene set
Gbe enriched in pathwayA?
| User Genes | Genome | |
|---|---|---|
| In Pathway | l | n-l |
| Not In Pathway | k-l | m-k-n+l |
- A statistical variable
odds ratiowould be computed:
\(Odds\ ratio = \frac{l * (m-k-n+l)}{(k-l) * (n-l)}\)
- Hypothesis: Odds ratio equals 1. A Hypergeometric test would be used to check if the
Odds ratio > 1.
8.2 Choose options for each required parameters step by step
Just select each parameter sequentially as labeled in the figure (or simply just click the Demo1 button).
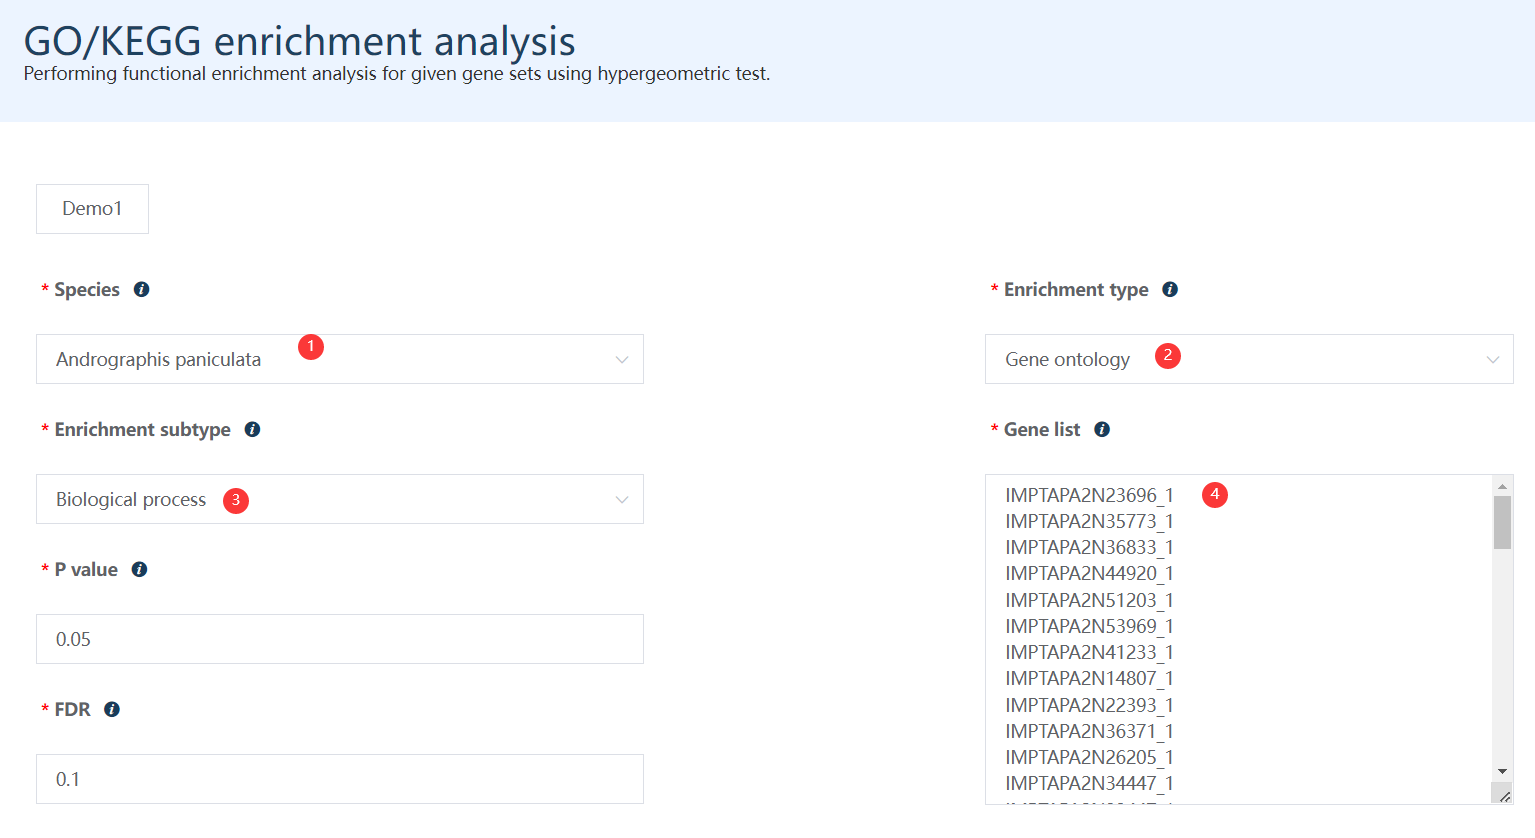
Figure 8.1: A screenshot of the one type of selection for GO Biological process enrichment for some differentially expressed genes identified in chapter 5.
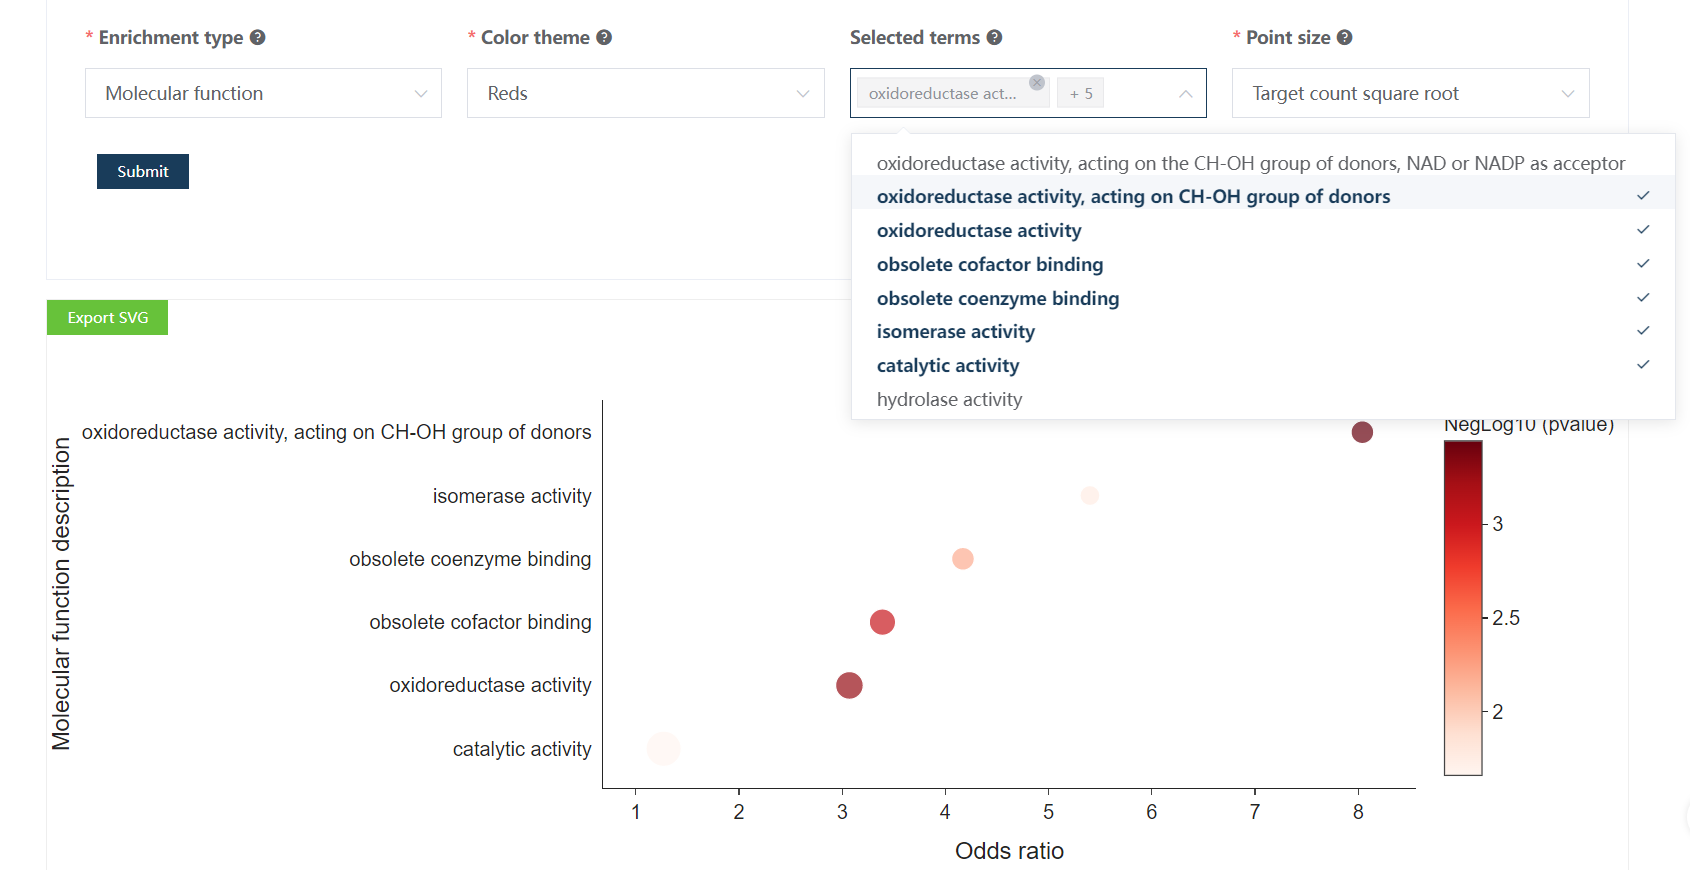
Clicking Submit, after several seconds, one bubble plot and one table are generated below.

Note
Users are allowed to choose which enriched terms to be visualized in the bubble plot.
Note
Users could check gene detail information by clicking gene names in the enrichment table.