3 Global search genes by IDs, functions, and pathways
On the index page, a global search function is provided for quickly accessing one or a series of genes. Normally, we may not remember the IDs of genes. But, we could search genes by function descriptions or keywords. This would facilitate the usage of IMP.
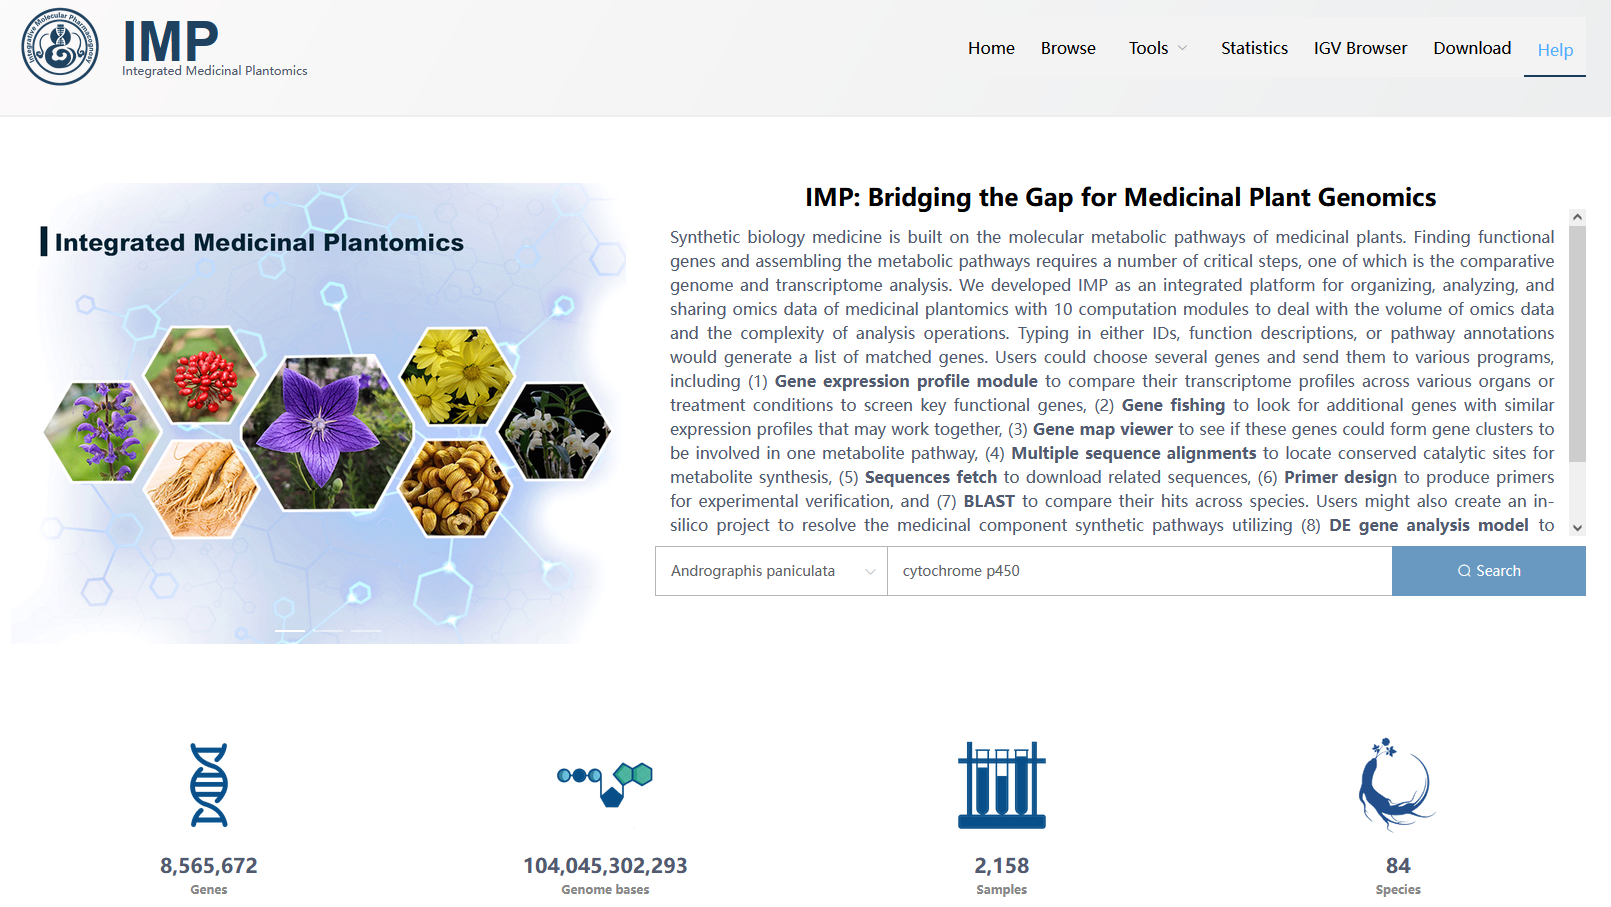
Figure 3.1: A screenshot of the index page.
For example, we want to search for cytochrome p450 genes in Andrographis paniculata. We could operate in the following 3 steps:
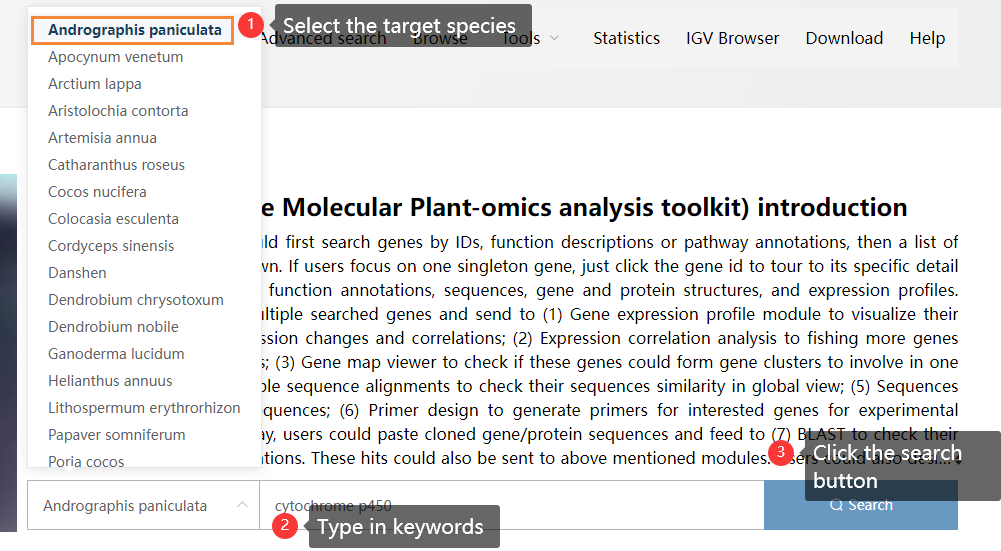
Figure 3.2: Searching for cytochrome p450 genes in Andrographis paniculata using the global search function.
Totally, 501 related genes are returned. From the descriptions, we could see some genes are Cytochrome P450 (these are what we searched).

Some genes are glutathione s-transferase and UDP-Glycosyltransferase. This is not wrong since the keyword Cytochrome P450 must be contained in one of their functional annotations. We could check the detailed information of these genes by clicking the gene names.
3.1 Gene detail page
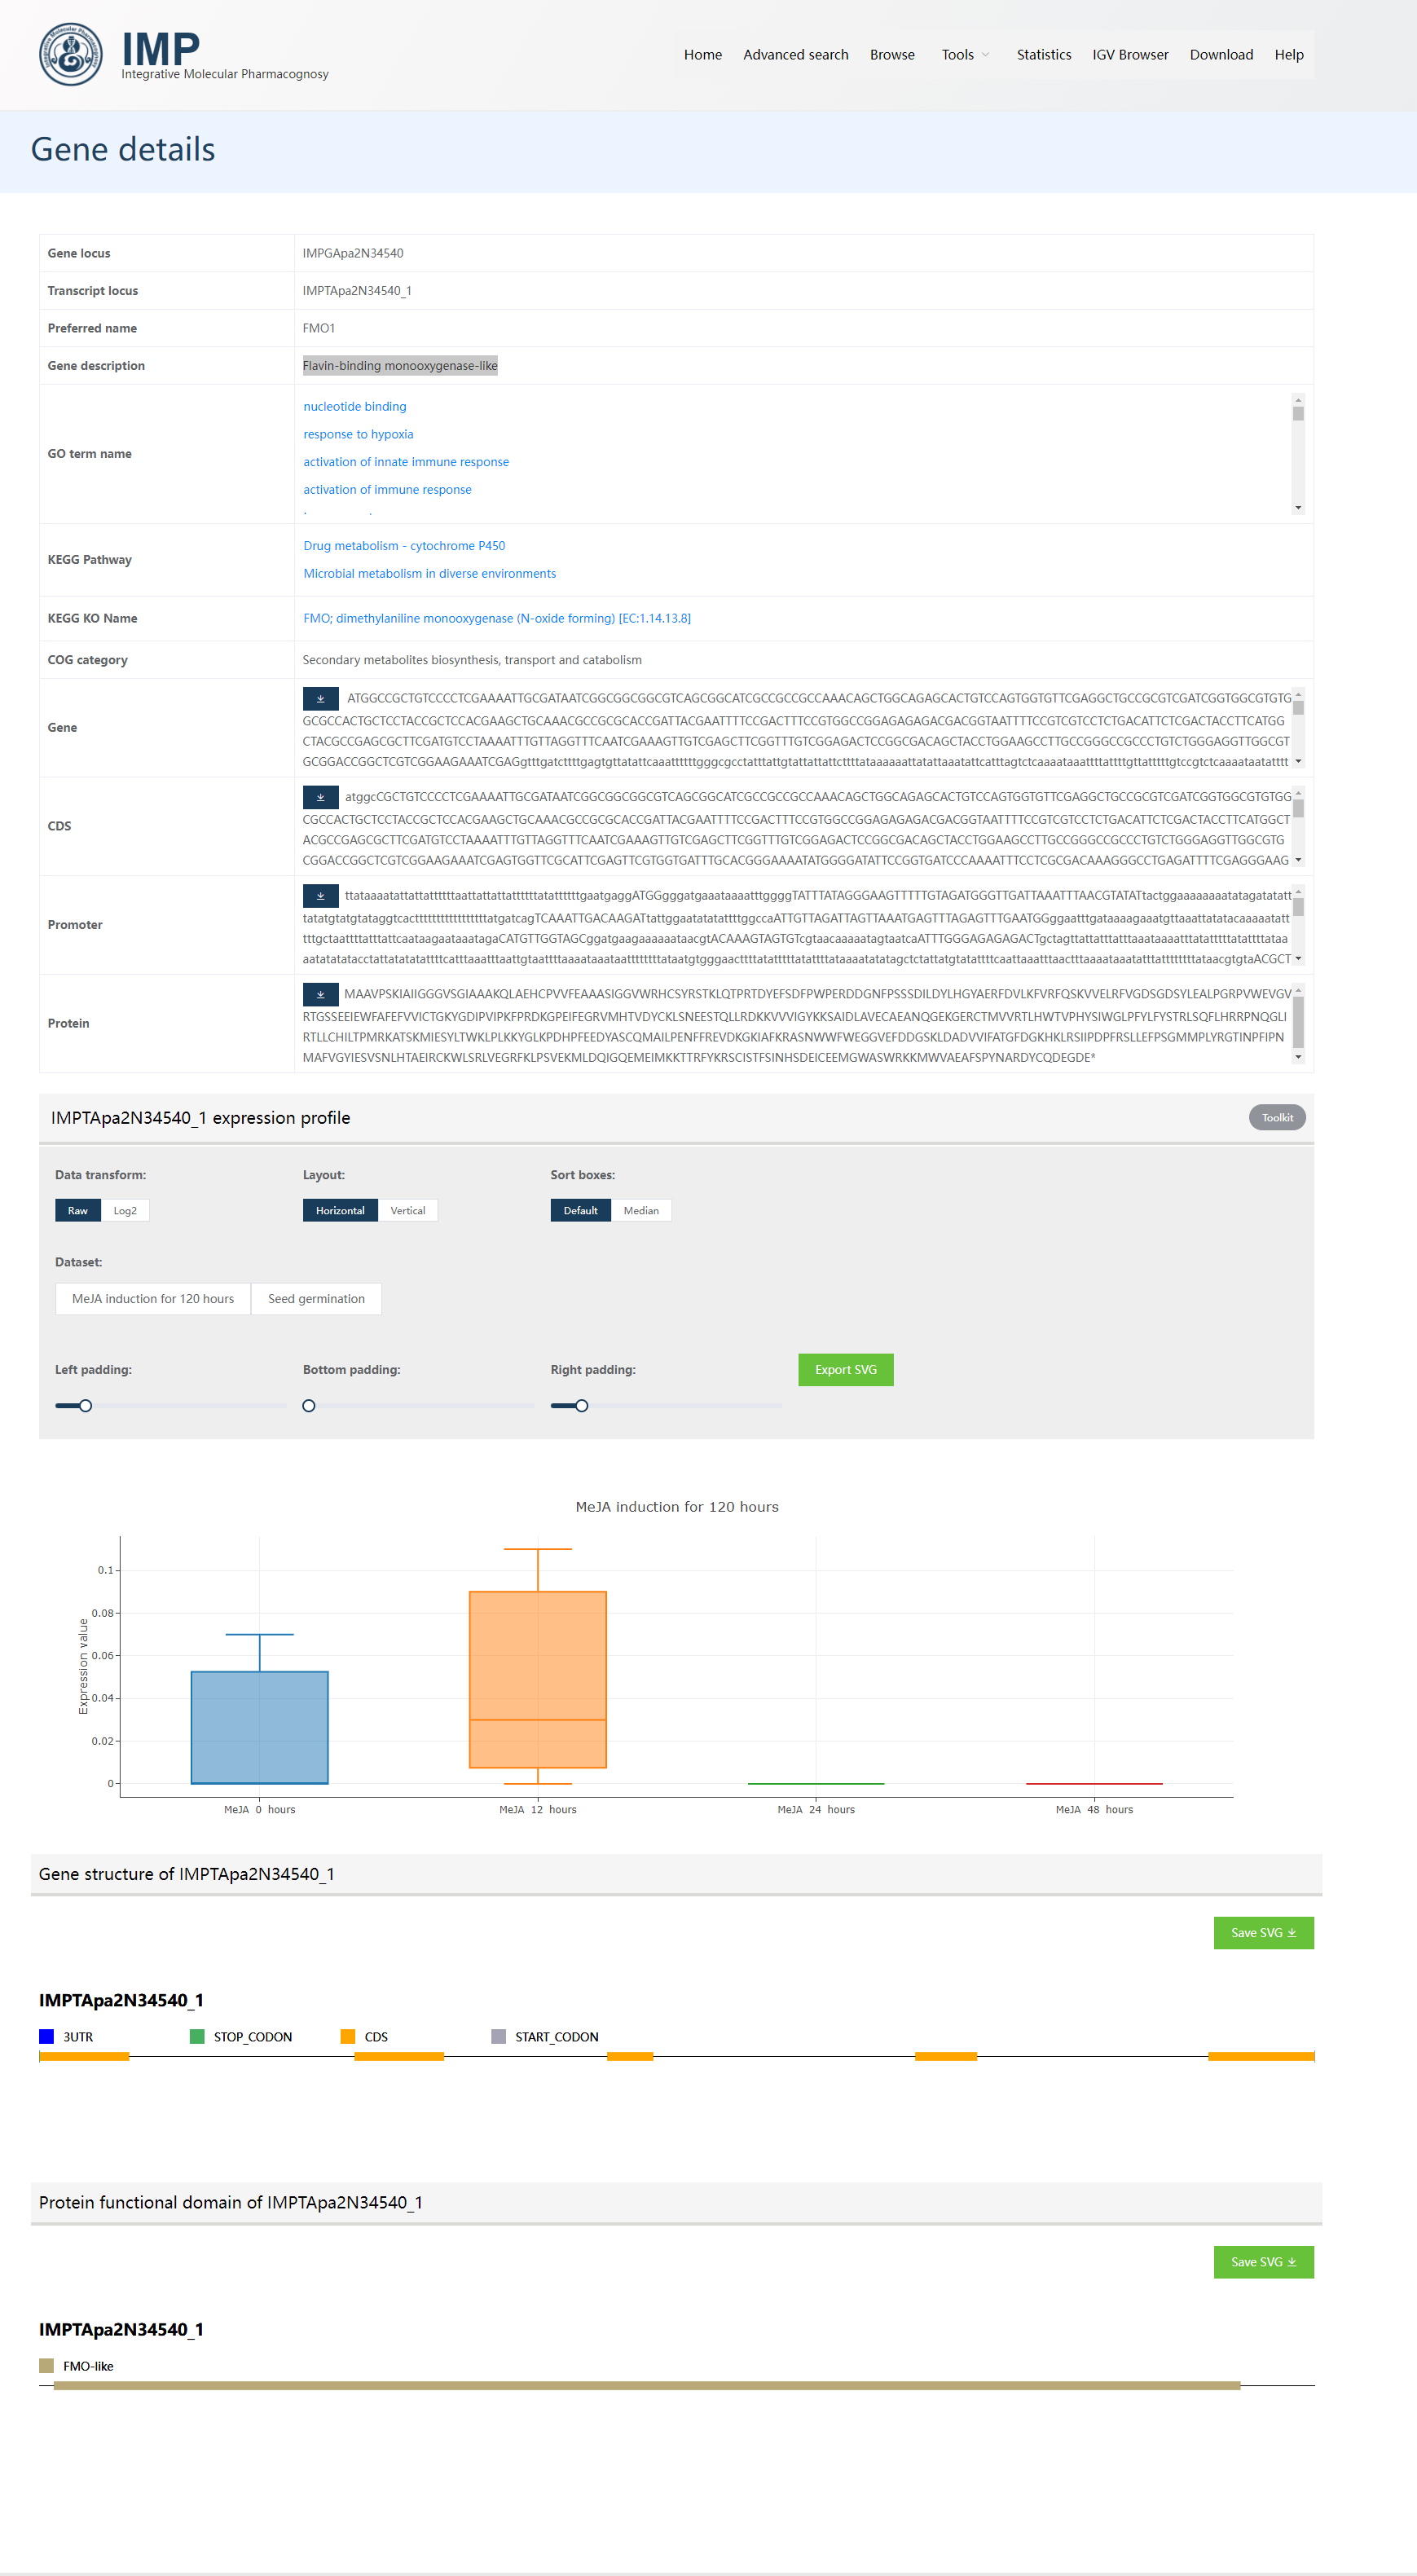
As for transcript IMPTApa2N34540_1, this is a Flavin-binding monooxygenase-like gene. The below screenshot could be classified into 5 parts.
The basic annotation information like
Gene locus,Transcript locus,Preferred name,Gene description,GO term name,KEGG Pathway,KEGG KO Name,COG category. One could click the blue text to tour Gene ontology, and the KEGG database for more information. Normally, these page transitions are not required.The sequence part contains
Gene,CDS,Promoter(upstream 2 kilobases of the transcription start site as defined as promoters here), andProteinsequences of the gene. These sequences could be directly copied or downloaded for other usages.Expression profile part showing the expression status of this gene in given datasets. One could change to
Log2transformed expression value, or change the layout or sorting ways.
Note
Especially, if X-axis tick names are very long, one could modify the padding options to show whole names.
Note
Click the legend in the interactive plot could show or hide specified parts.
Gene structure part showing the
UTRs,Start/Stop codons, andCDSof this gene.Protein functional domain part showing the predicted PFAM domains of proteins encoded by this transcript. One could click the domain block to tour to EBI Pfam domain page to check the detailed information on these domains.
Note
Pictures with a
Save SVGbutton could be saved in vector format. If one wants the result in PNG format, a screenshot would generate high-quality results.
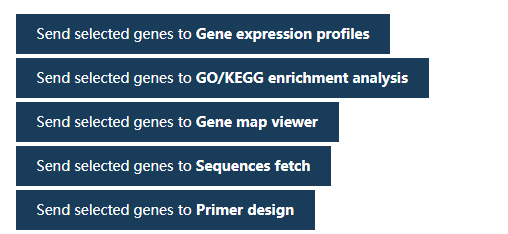
3.2 The send to buttons
Below the result table, there are several buttons that could help to transfer selected genes to specialized modules for further exploration.
This is feasible and could spare the typing of gene names one by one. The description of these modules would be listed on each module help page.