5 Gene expression profile
Visualizing expression profiles for one or more genes using bars, lines, boxplots and heatmap plots.
5.1 Choose options for each required parameters step by step
Just select each parameter sequentially as labeled in the figure.
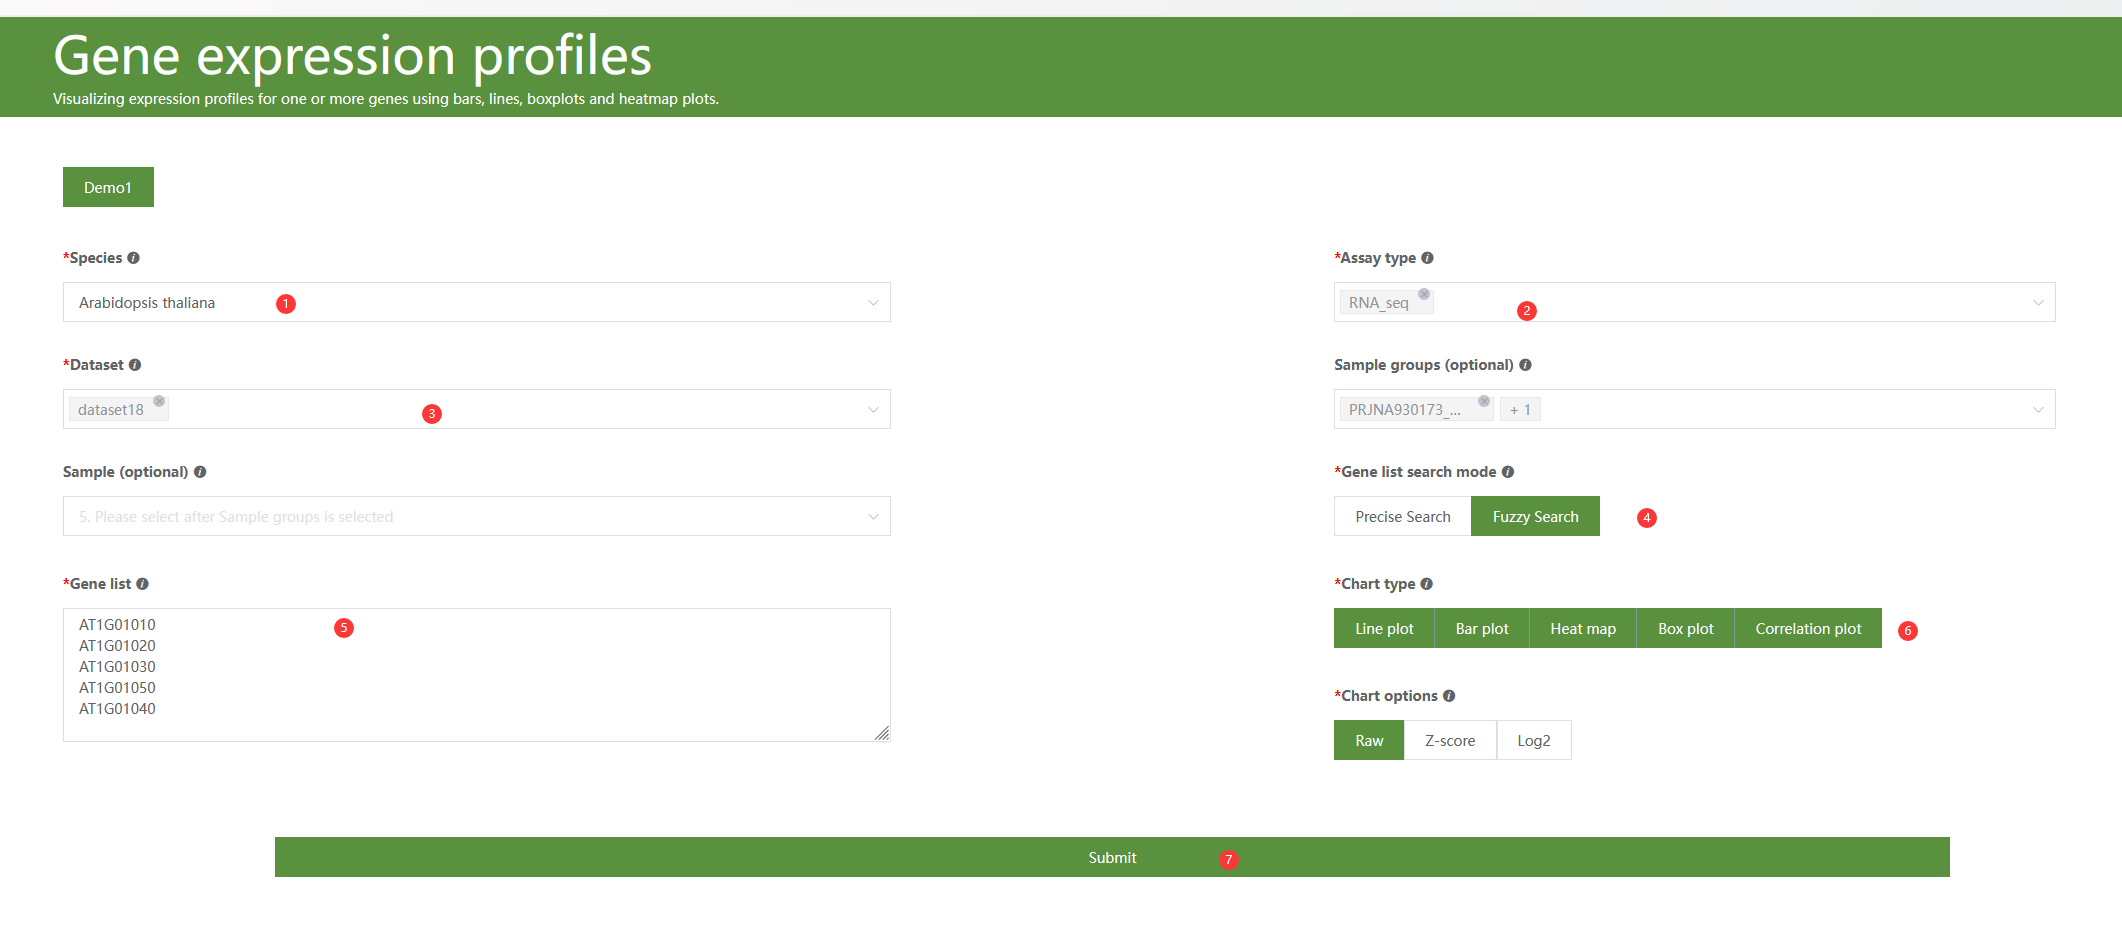
Figure 5.1: A screenshot of the one type of selections for gene expression profile analysis.
Clicking Submit, after several seconds, 4 plots are generated below.

5.2 The precise search and fuzy search mode
- In Precise search mode: only gene ids or transcript ids separated by newlines are supported.
Gene1
Gene2
Gene3- In Fuzzy Search mode, searching genes by functions, pathways, gene ontology are supported. For example one can search all
CYPgenes.
CYP450
UGT
FPP GGPP synthase
Terpenoid backbone biosynthesis