8 Gene fishing
Searching for genes with similar spearman correlation expression profiles like given genes.
8.1 Choose options for each required parameters step by step
Just select each parameter sequentially as labeled in the figure (or simply just click the Demo1, and Demo2 buttons).
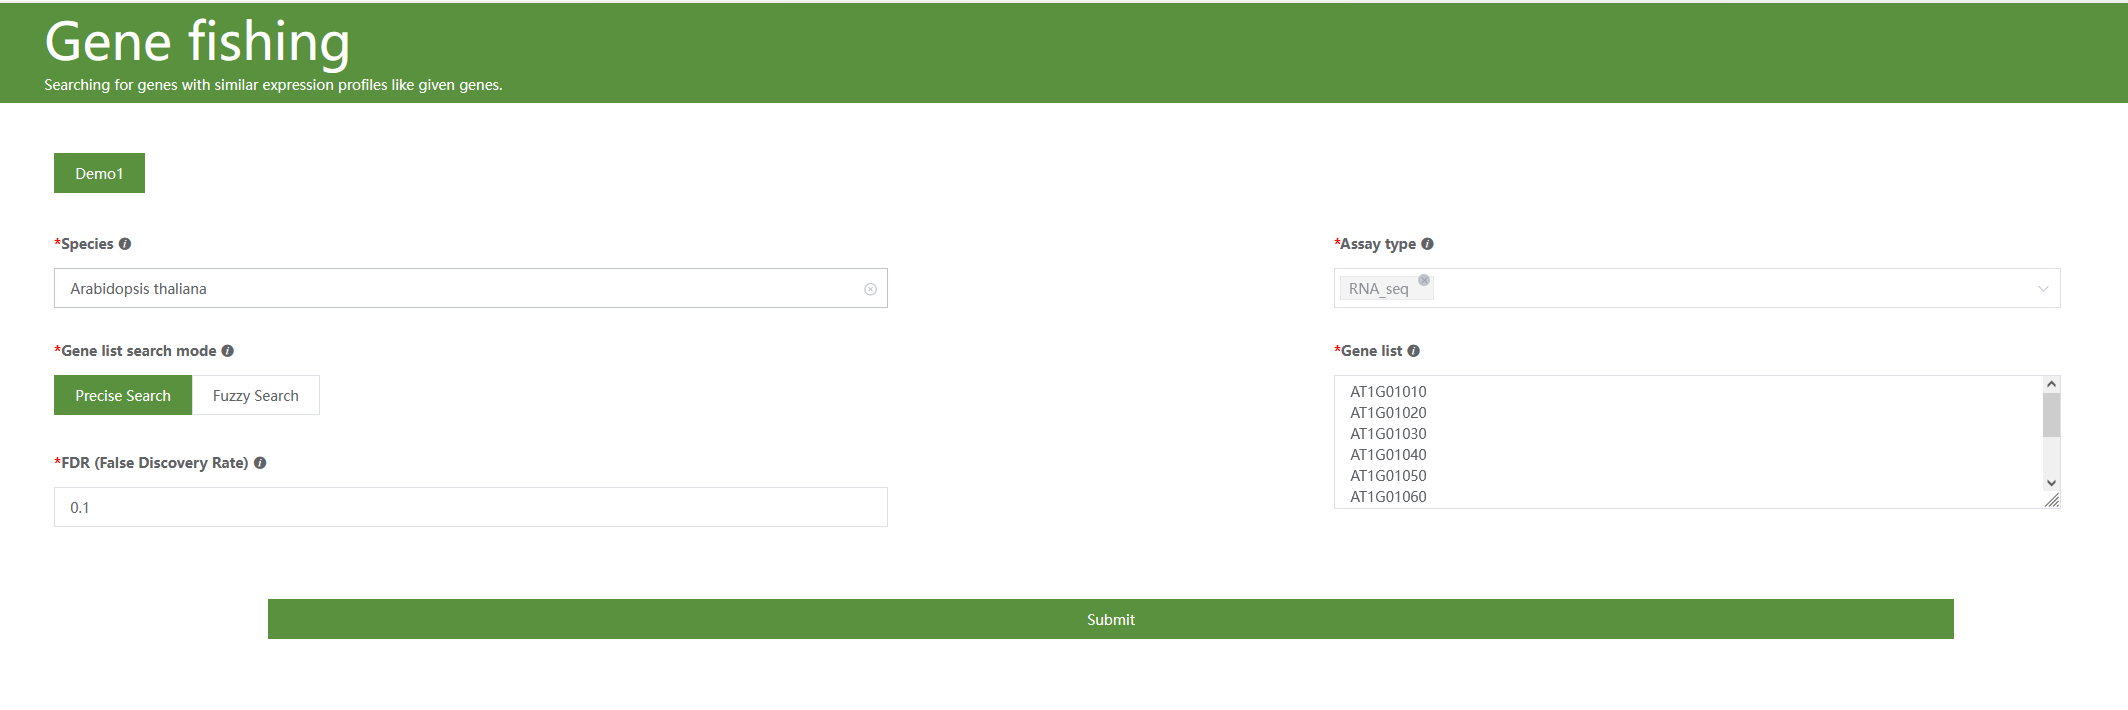
Clicking Submit, after several seconds (about 10 seconds), one network would be generated below.
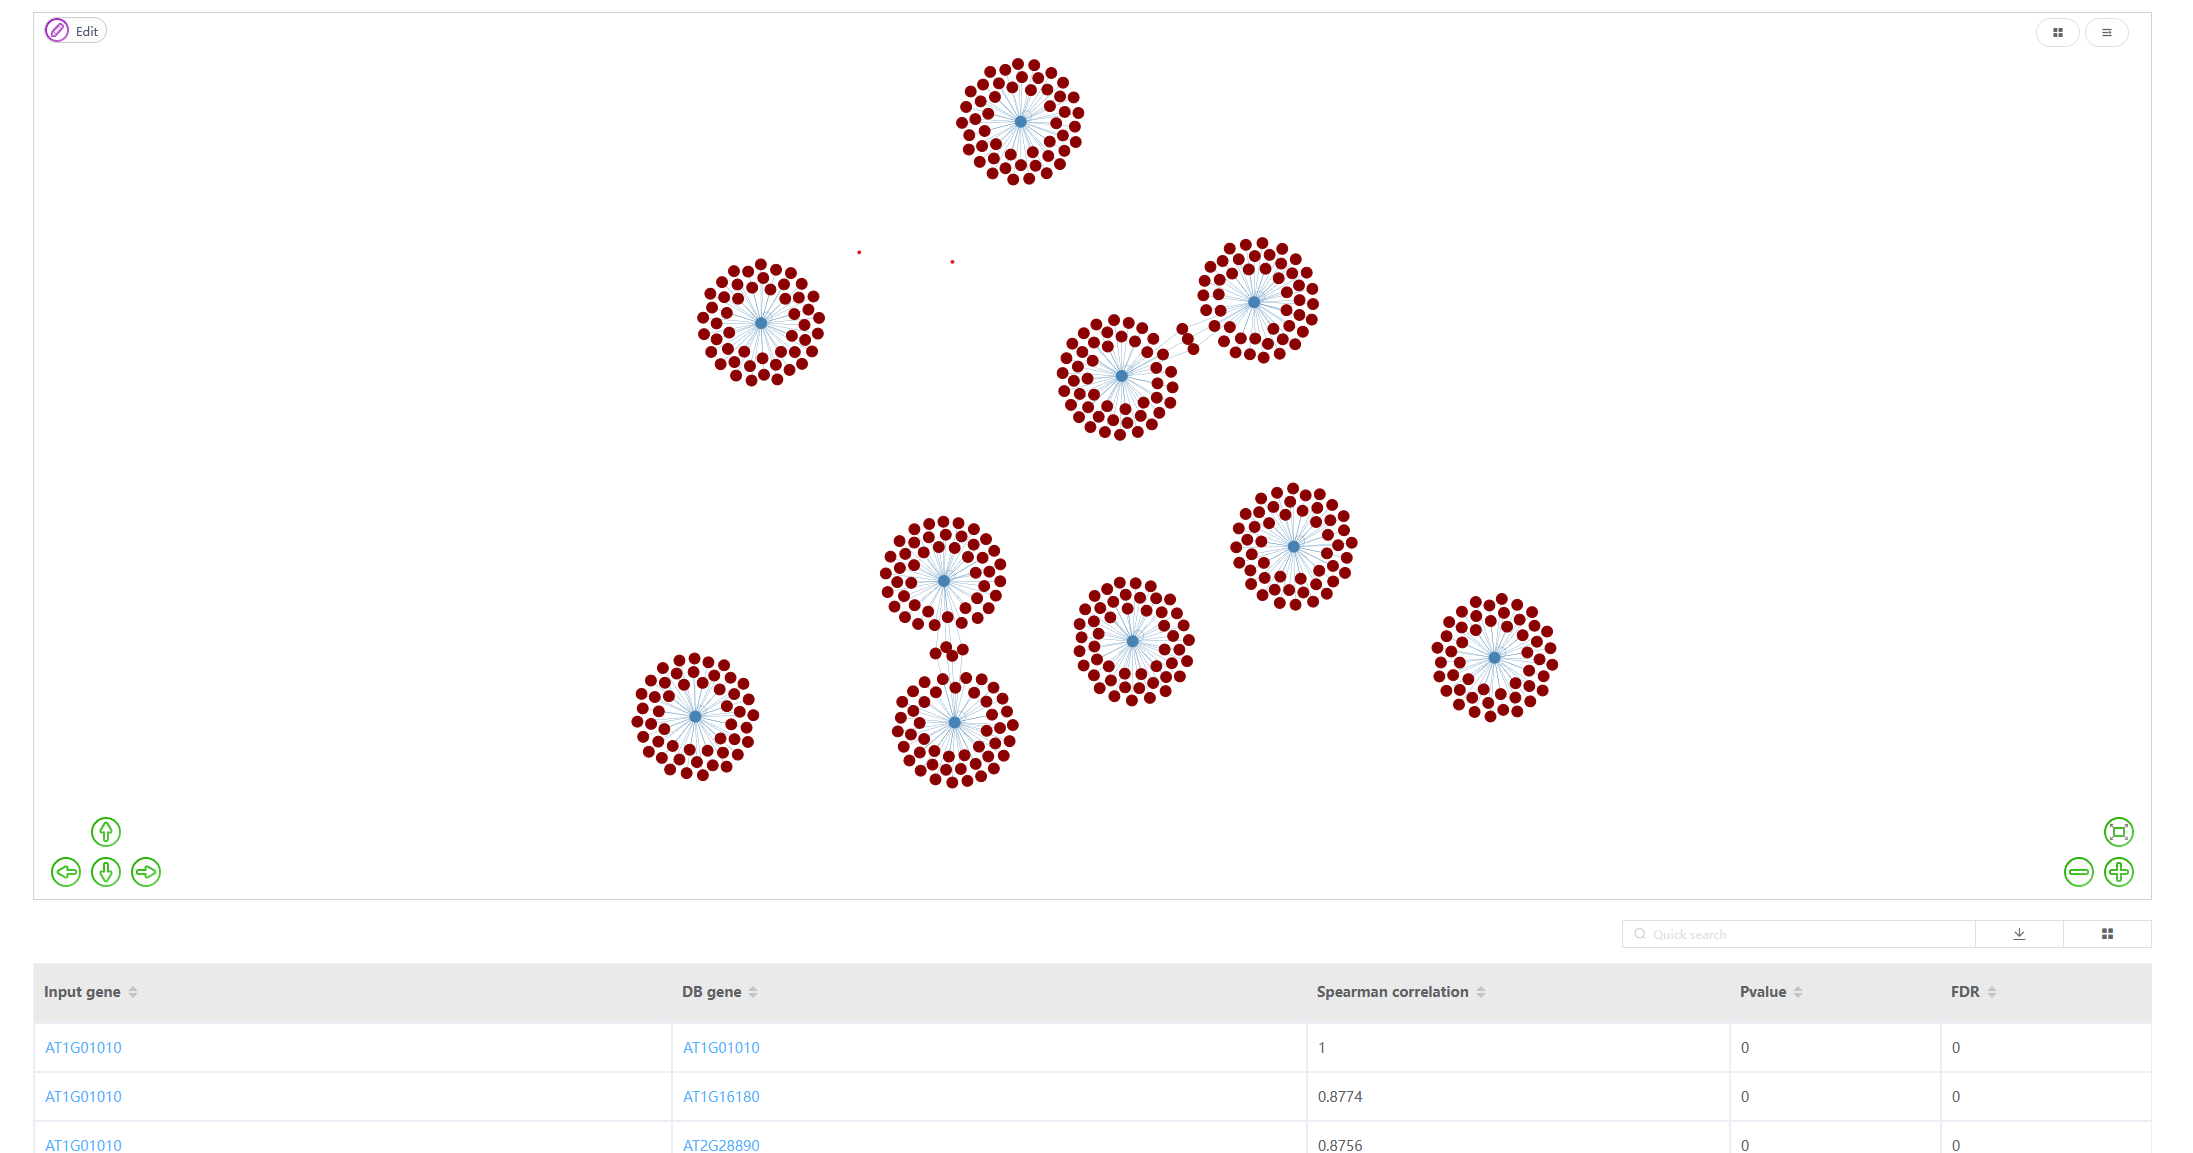
Figure 8.1: The blue dots are user input genes. Brown dots are the ones with similar expression profiles to input genes. The table below shows detailed correlation statistics.
Below the figure is a table presenting detailed co-expression gene information.
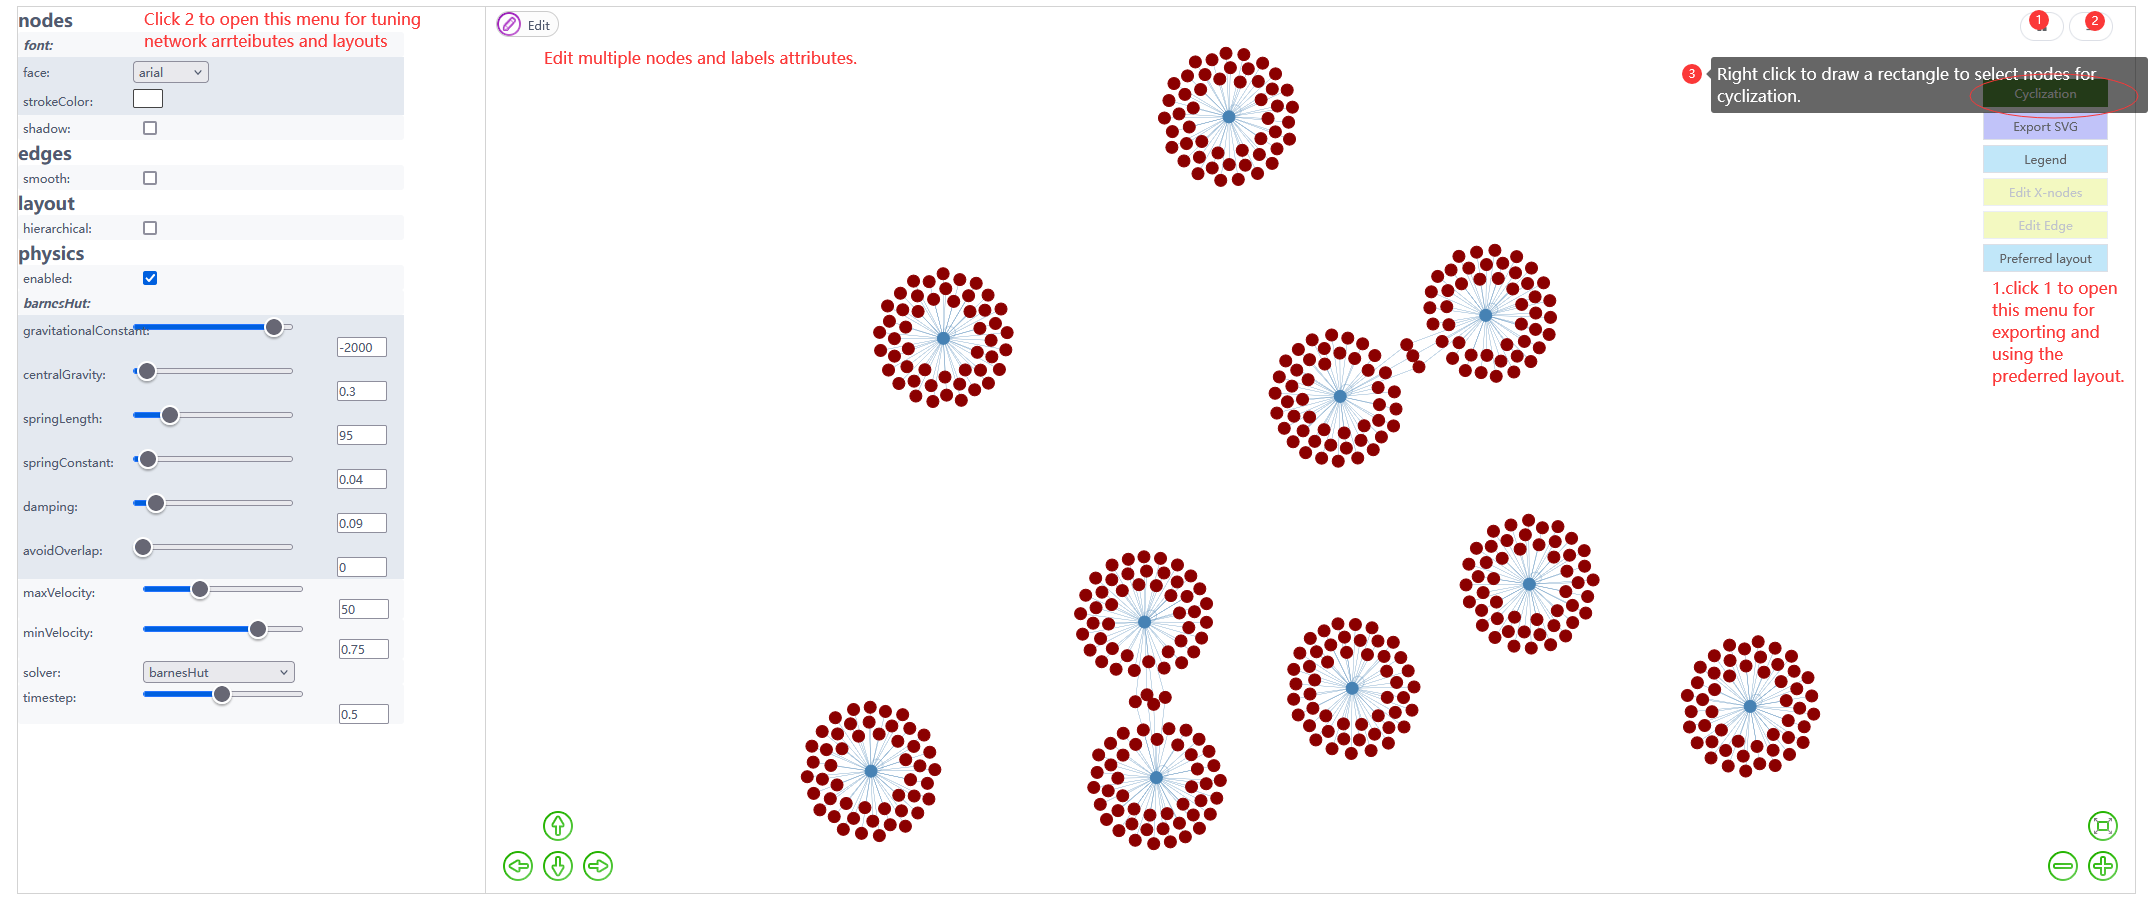
8.2 Network toolkit
Note
1.Computing correlation value for more genes would enlarge the computing time which may cause connection timeout. 2.If more than 400 genes were input, the module would select only the top 400 genes with the maximum variance values for computing. 3.For the network plot, only the top 500 correlation connections would be shown. The full results table could be downloaded