9 Gene map viewer
Visualizing genes distribution along chromosomes/scaffolds/contigs for checking gene clusters.
9.1 Choose options for each required parameters step by step
Just select each parameter sequentially as labeled in the figure (or simply just click the Demo1, and Demo2 buttons).
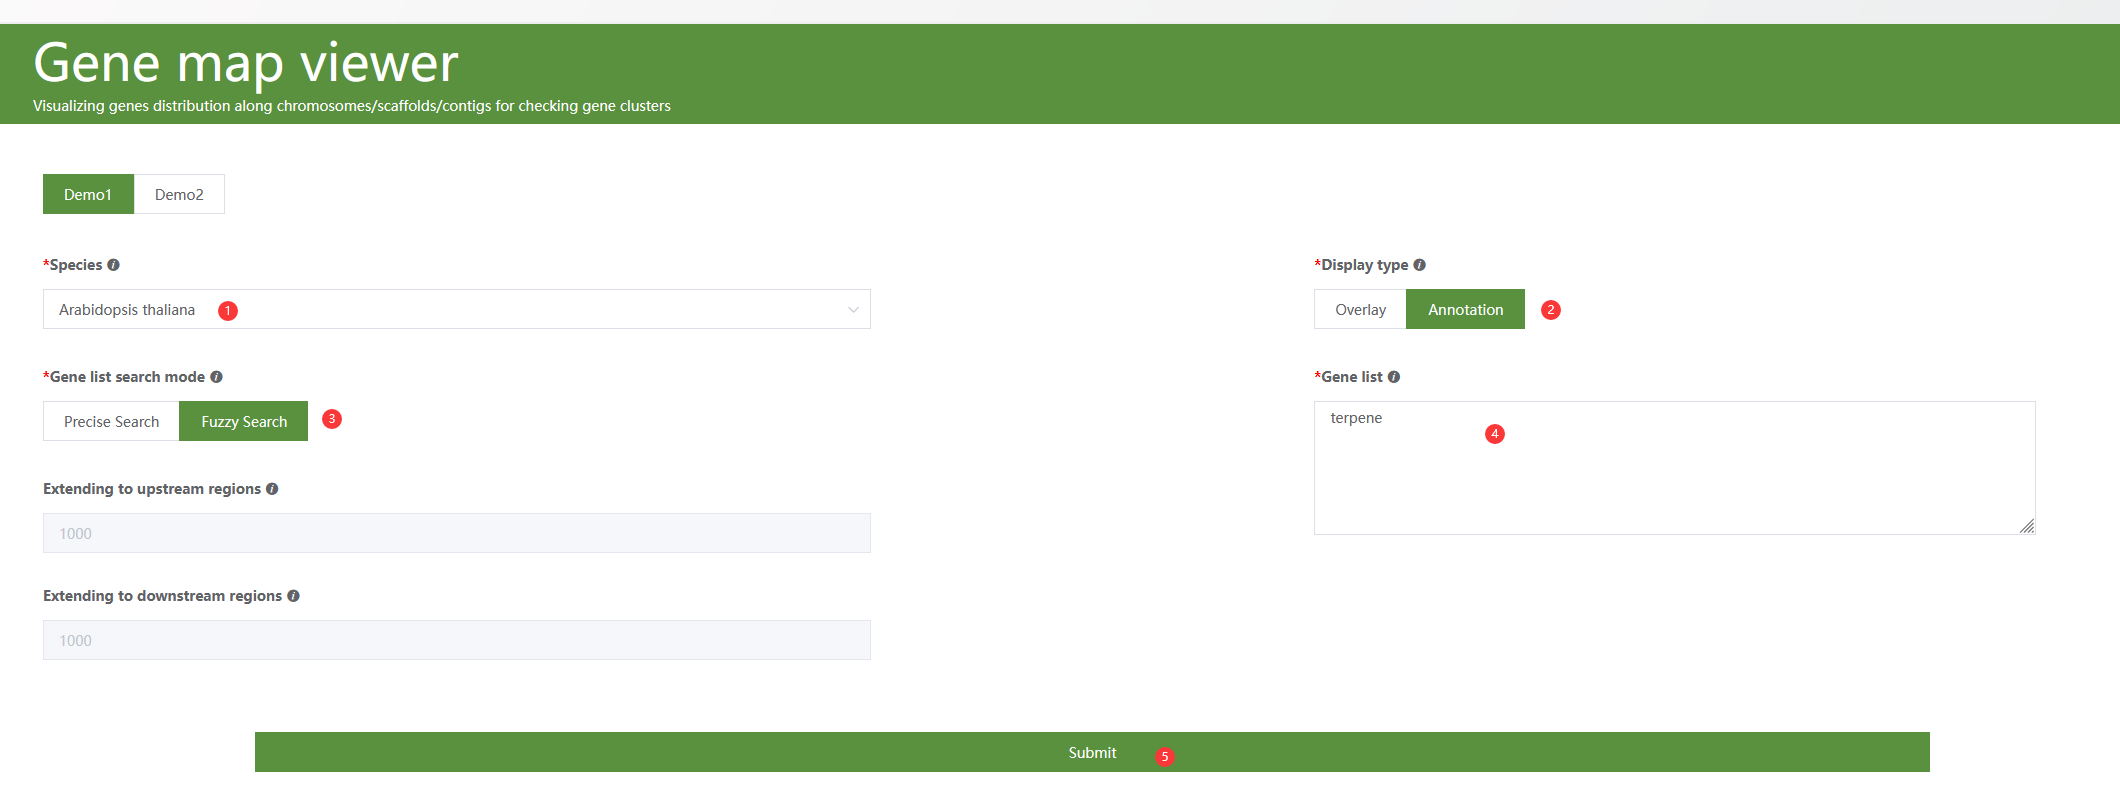
Figure 9.1: A screenshot of the one type of selection for Gene map viewer.
Clicking Submit, after several seconds, one Gene map viewer plot is generated below.
Note
Mousing over the plots would see the names of each gene. Triangles represent genes, where red signifies that there is only a single gene at that position, while green denotes the presence of a gene cluster.
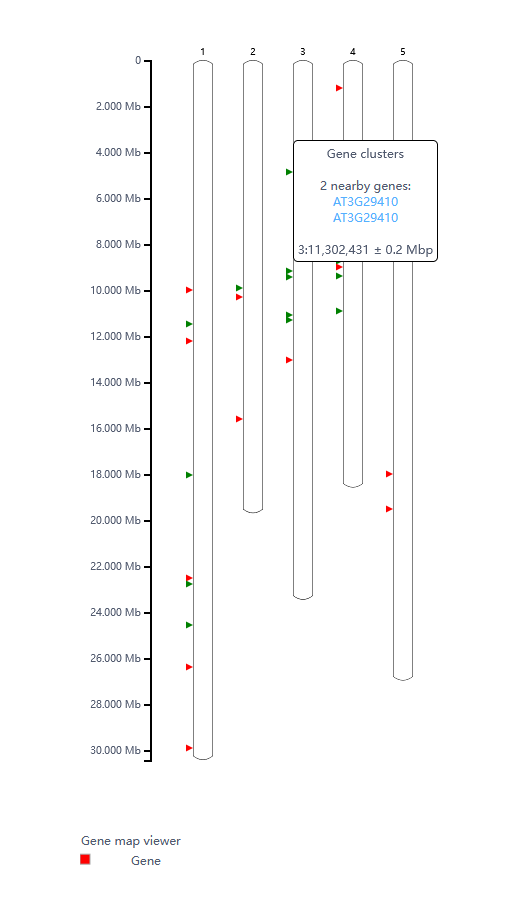
Figure 9.2: (ref:gsearesultallplot36)
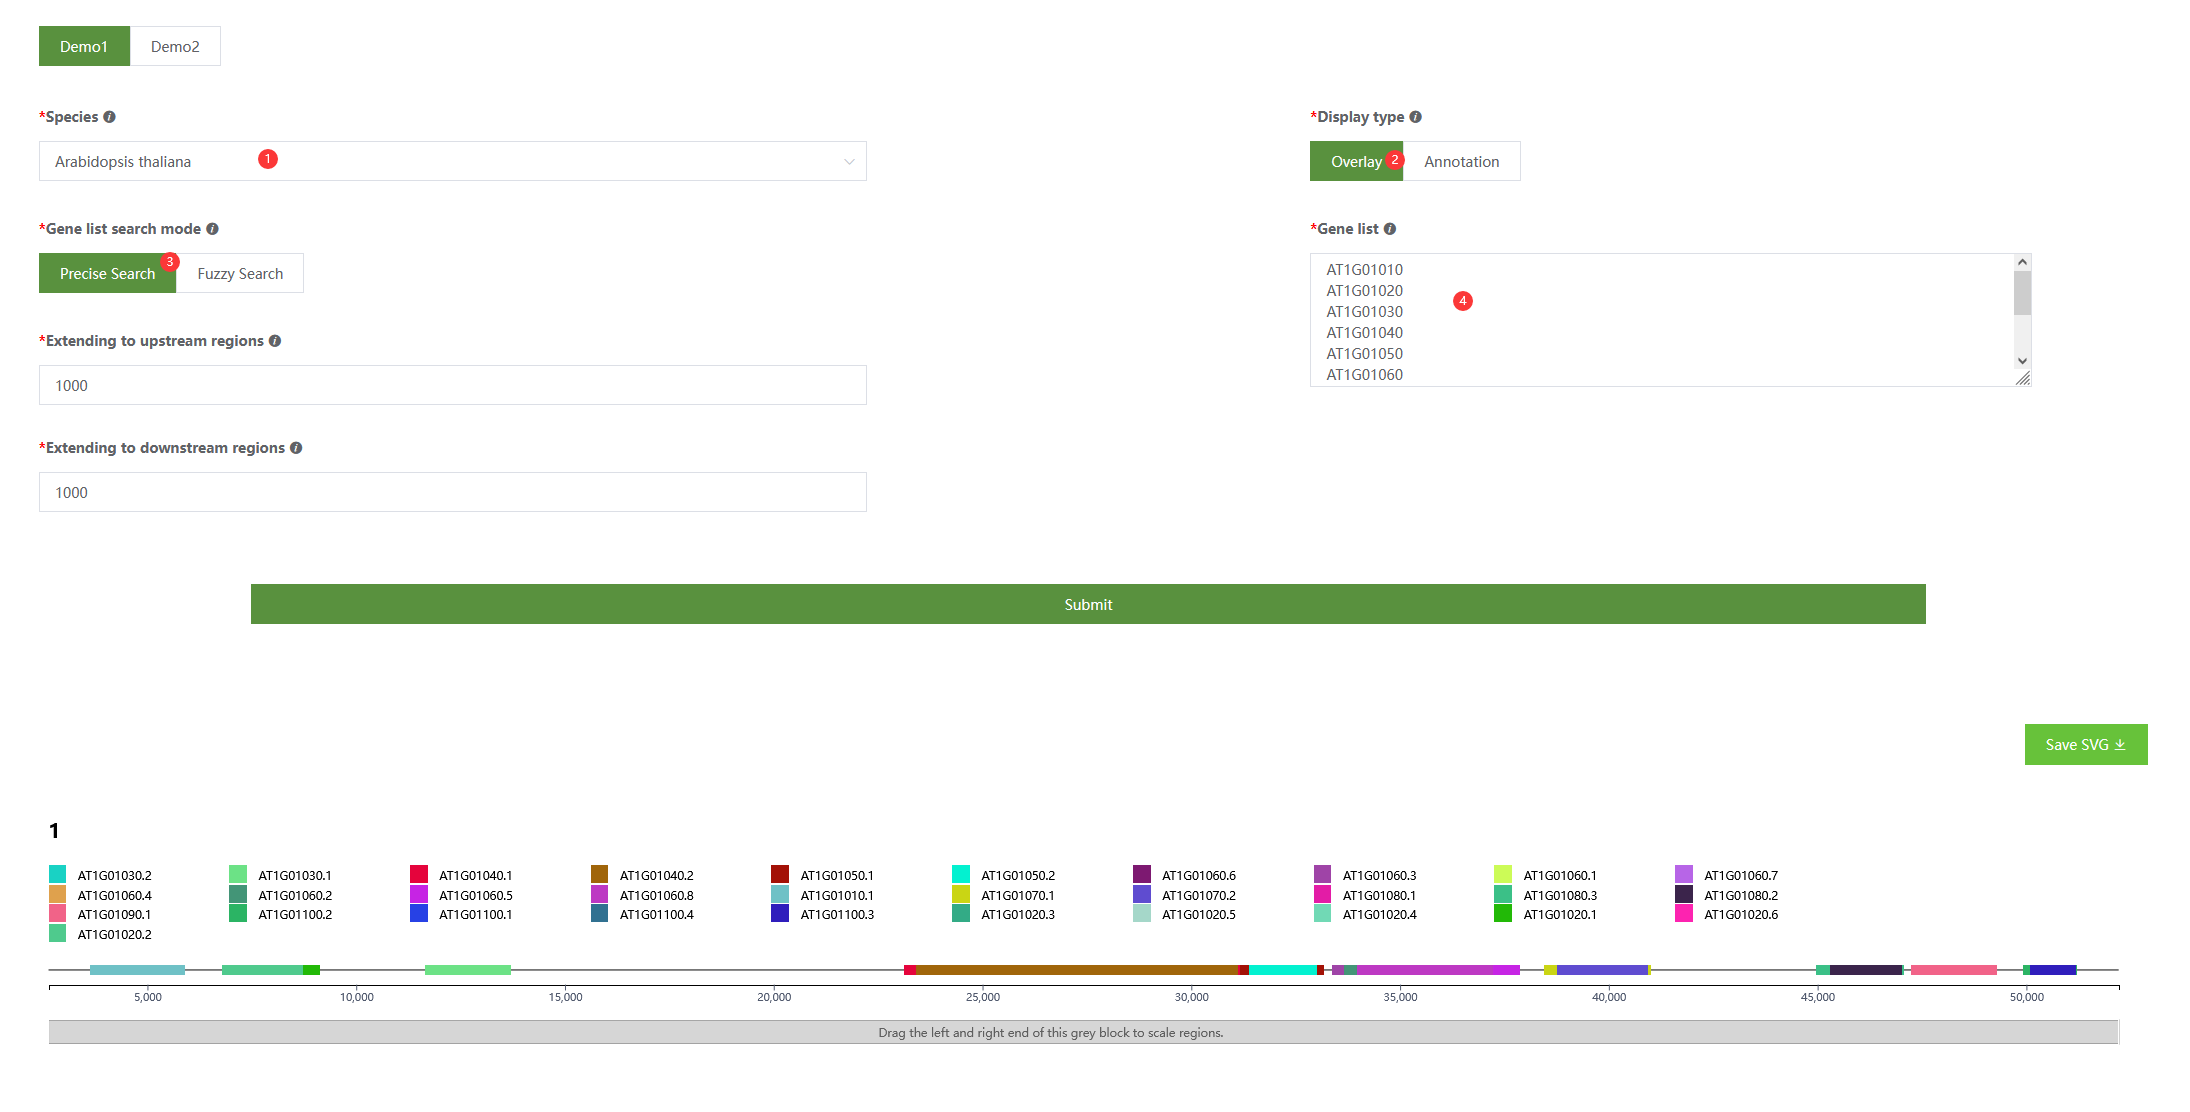
9.2 Overlay and annotation mode
Users are allowed to choose the display mode: Overlay or Annotation.
Overlay: zooming in to the region which just covers user input genes.Annotation: showing gene distribution at the whole chromosome level (only chromosomes containing user input genes would be shown)
Note
The order of legend is similar to their positions in the chromosome/scaffold.
Note
Users could check gene detail information n IGV Browser by clicking gene names in the plot.