15 Methy view
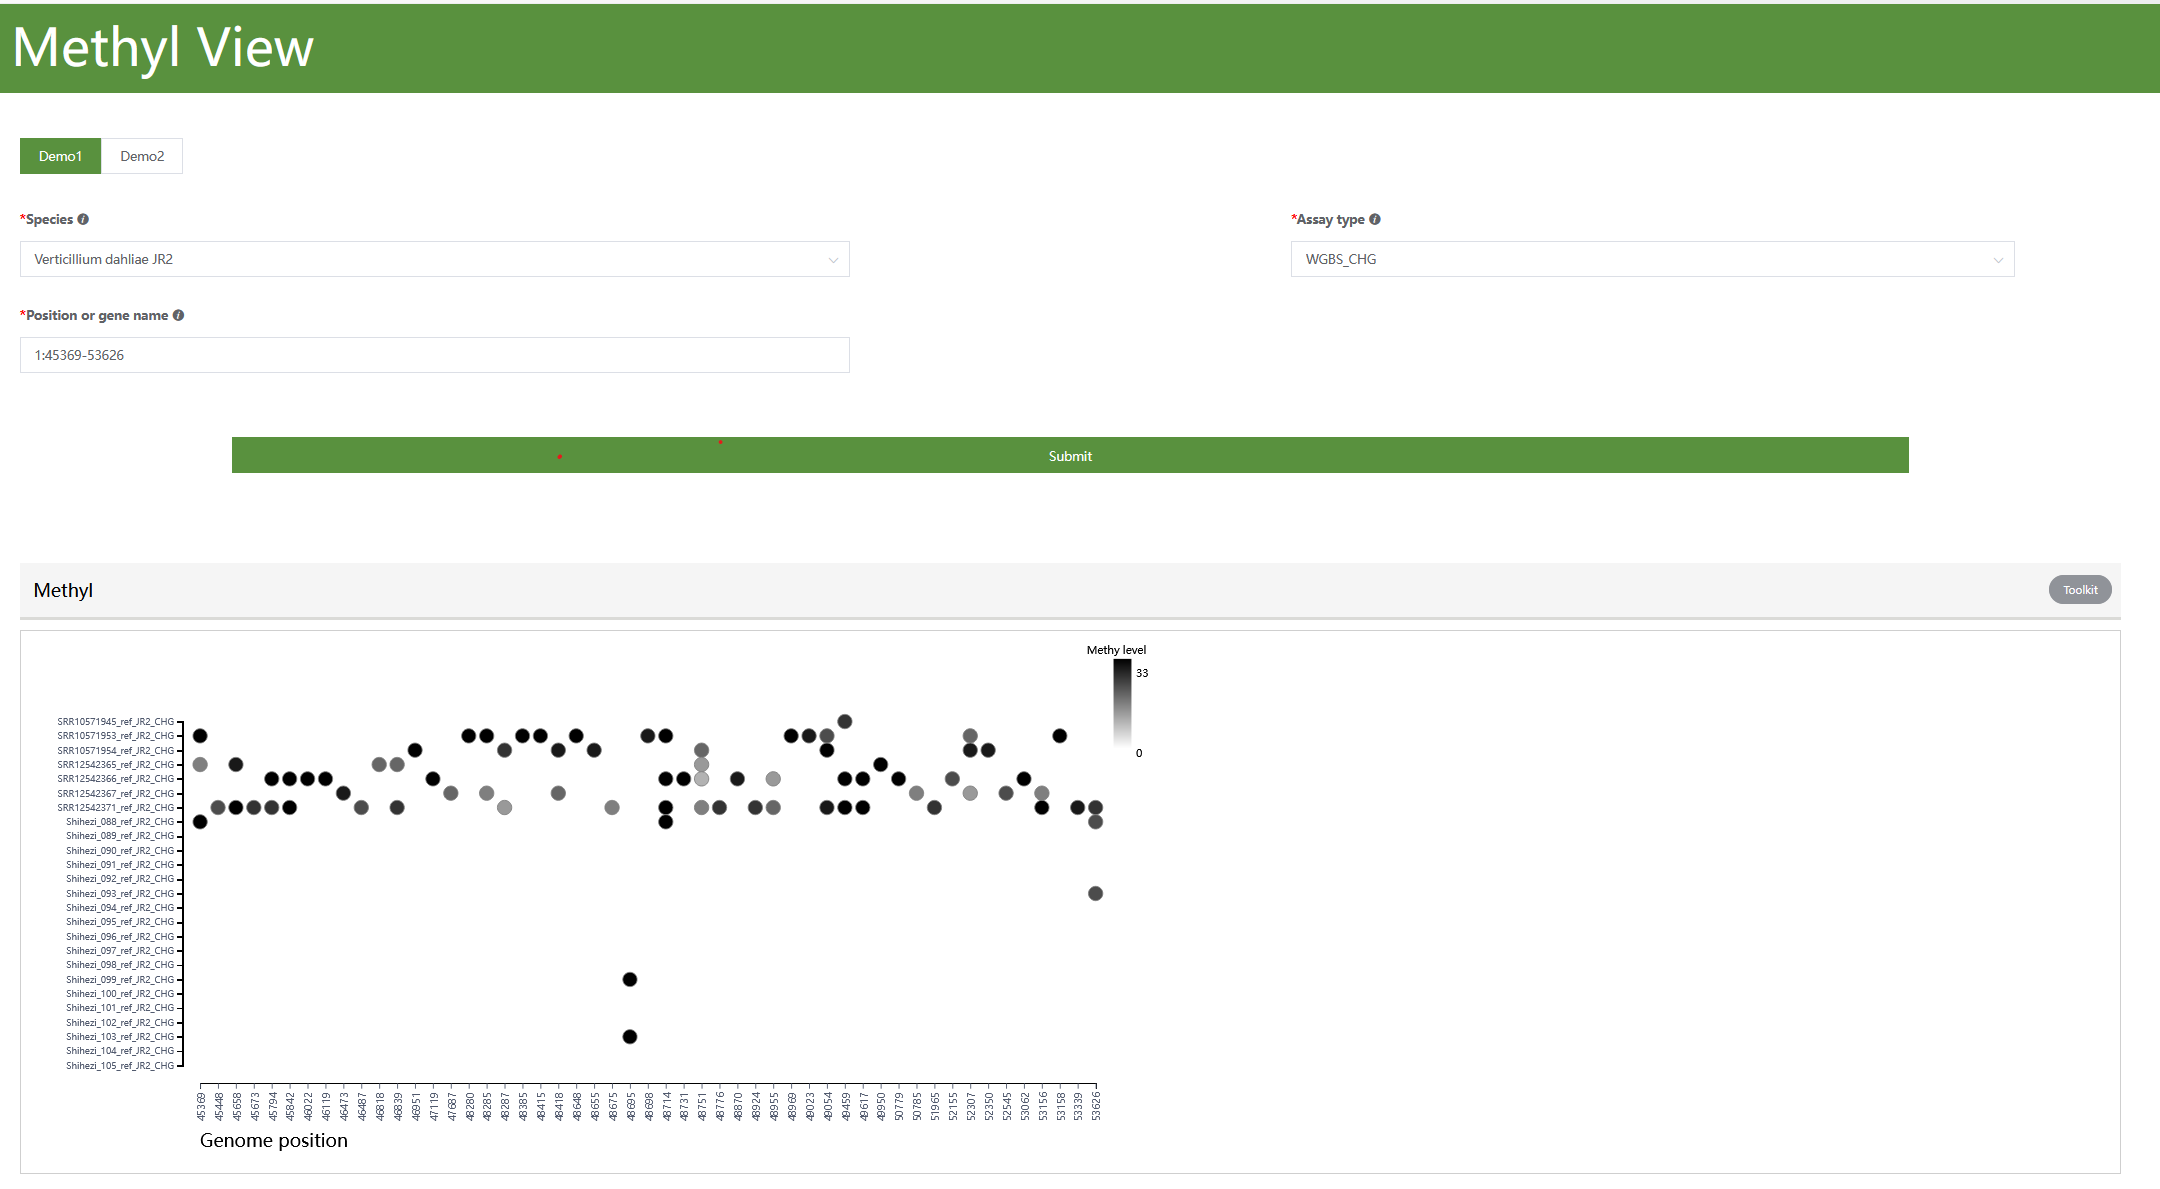
This segment constitutes the Site Methylation Percentage Display Module, wherein the selection of ‘Demo1’ triggers the depiction of probable methylation sites within a predefined genomic region, accompanied by their respective methylation percentages. These sites are depicted using dot markers, where a deeper hue corresponds to a higher methylation rate.
Note
The Y-axis represents various samples, and in cases where a region corresponding to a given sample lacks representation of methylated sites, it suggests that either no methylation has occurred at those loci or the loci are potentially unmethylated relative to the reference genome, or they might be absent in the sample compared to the reference.