2 Statistic: Browse database sample information
One could browse all included sample information on the Statistic page. It contains two parts:
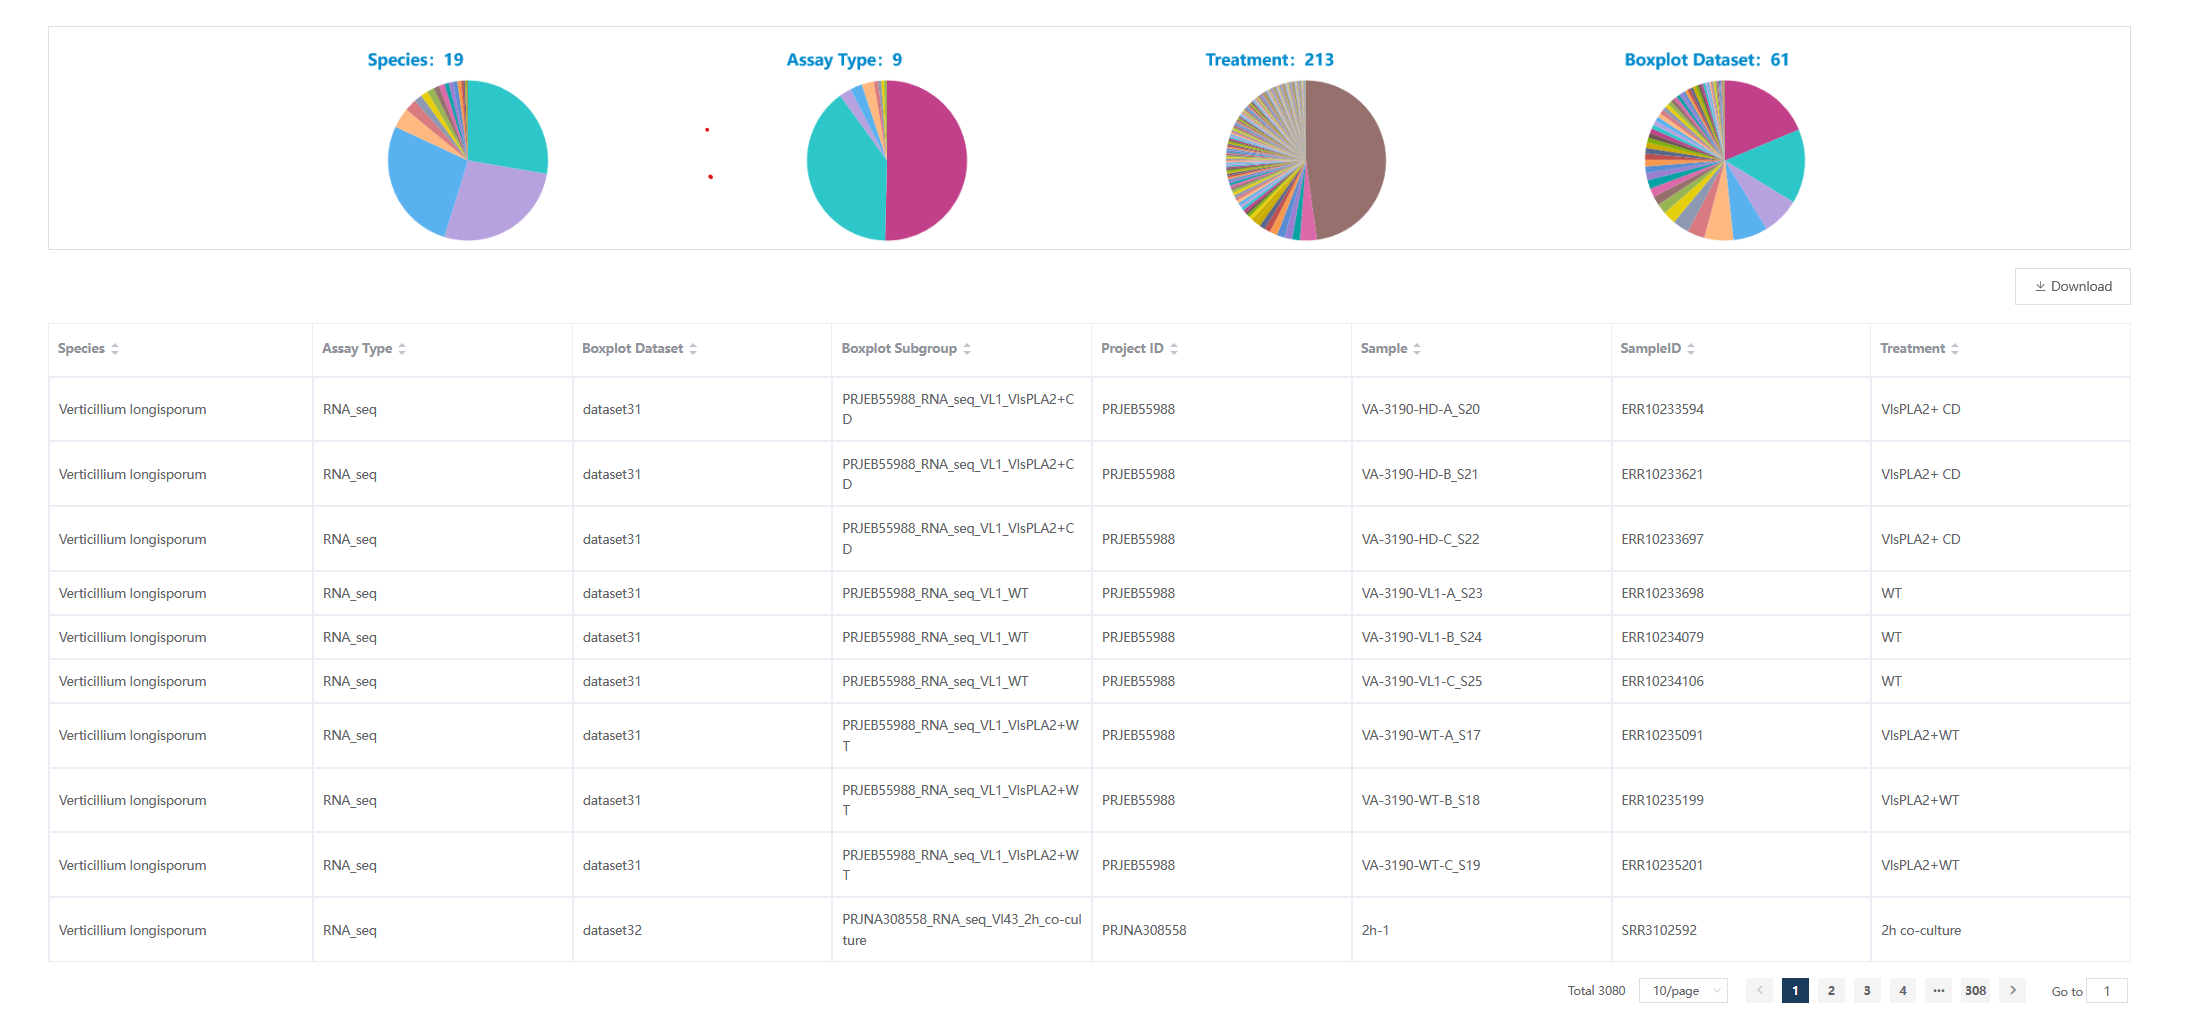
- Interactive summary pie charts. Four pie charts showing the basic info of included sample.
Note
Clicking one piece of the pie chart could perform data filtering.
- A table showing the detailed information of the sample. One can click on the ‘Specials’ link to view all sample information pertaining to this species. Clicking on the ‘Assay Type’ will allow you to explore details concerning a specific sequencing type. For accessing sample data under a certain treatment condition, click on the ‘Treatment’ option. To concentrate on sample data within a defined subset, select the ‘Boxplot Dataset’. Every click essentially acts as a filter, enabling users to sift through the data according to their chosen parameters.